


Research — 27 Jul, 2023
Specialty commercial writers soar in US P&C insurance performance rankings
By Terry Leone and Tim Zawacki
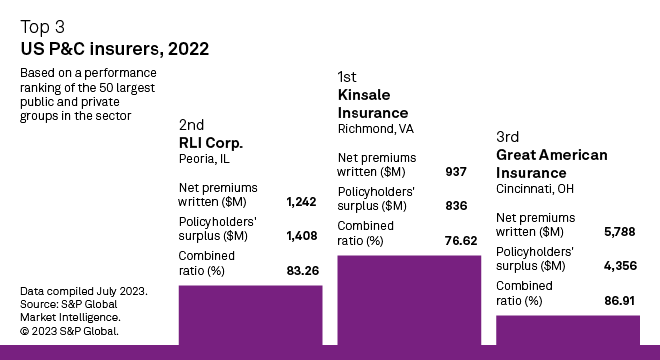
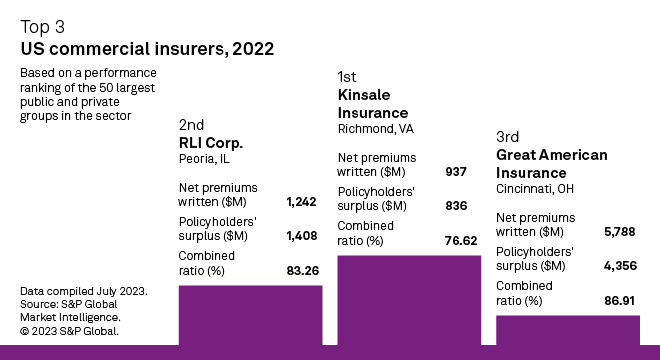
Rapid growth and strong underwriting profitability earned Richmond, Va.-based Kinsale Capital Group Inc. the top position in an S&P Global Market Intelligence analysis of 2022 statutory financial performance of the largest US property and casualty insurance groups.

A writer of hard-to-place casualty, property and professional lines risks, Kinsale headed a list dominated by commercial lines writers in an outcome that reflects the highly favorable underwriting performance that industry segment delivered in 2022. The US commercial lines combined ratio of 94.4% for the calendar year was the best result since 2015, with profitability in the casualty lines, which accounted for a substantial majority of Kinsale's premium volume, leading the way.
Specialty commercial insurers RLI Corp. and Great American Insurance, the name American Financial Group Inc. uses to conduct business, placed second and third, respectively. The Progressive Corp., placed as one of only three personal lines-focused entities in the top 50, outperformed peers in one of the most challenging operating environments in more than a generation in its core private-passenger auto business. The industry's personal lines combined ratio of 109.9% was its highest since 2001.

 |
– Access the performance rankings for the top P&C insurers in the analysis. – Access our interactive US P&C insurance performance ranking template. – Register for a webinar outlining the performance rankings methodology and discussing the secrets of the top-ranked company's success with President and CEO Michael Kehoe. |
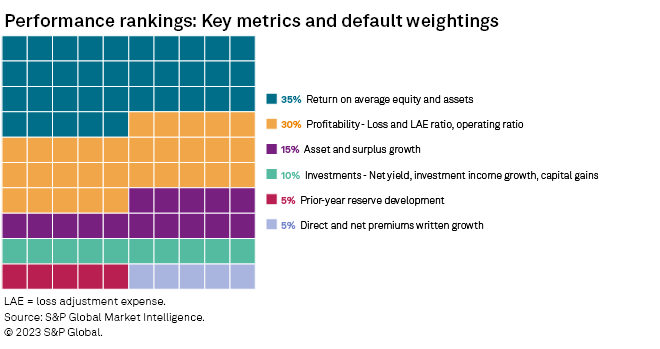
The performance rankings are determined using 13 financial metrics from 2022 statutory filings grouped into six buckets: rates of return, underwriting profitability, balance sheet expansion, investment performance, prior-accident-year reserve development and premium growth. We assign the buckets distinct weightings to calculate performance scores for each of the 100-largest US P&C groups and stand-alone P&C entities based on 2022 net premiums written. We have separately ranked the performance of entities determined by Market Intelligence to have commercial and personal lines-focused operations. This breakout is particularly important in a year with the kinds of divergent outcomes we observed in 2022 to help distinguish those personal lines carriers that achieved relative outperformance despite fierce headwinds.
Top of the list
Kinsale, with a score of 1.67 based on our methodology, placed well ahead of RLI and Great American, which earned scores of 1.37 and 1.16, respectively.
Its return on statutory equity of 30.3% as measured by annualized income after taxes as a percentage of average capital and surplus was the highest among the 50 largest P&C insurers. Kinsale was second only to pet insurer Trupanion Inc. in terms of pretax return on average assets with a 2022 result of 10.1%. Rates of return on statutory equity and assets combine to hold the largest weighting of the six buckets at 35%.
Kinsale outperformed in key measures of underwriting performance. Its operating ratio, which reflects the combined ratio less the ratio of net investment income earned to net premiums earned, was second best among the top 50. Direct and net premiums written growth, each of which exceeded 40% at Kinsale, placed first and fourth among the top 50. Kinsale also outperformed most of the top 50 in terms of balance sheet expansion as measured by growth in net admitted cash and invested assets as well as policyholders' surplus.
The company has credited risk-selection and the demographics of its commercial customer base as drivers of its success. Kinsale focuses on classes of business where its underwriters have extensive experience, emphasizing small and mid-sized accounts with average annual premium volume of $14,700 where it believes it benefits from less competition in the marketplace. While commercial property represented Kinsale's largest category of business in 2022, based on company data, it accounted for only 16.8% of its 2022 gross premiums written. The company produced significant volume from a diversified mix of what it defines as the small-business casualty, excess casualty, construction and general casualty categories, among others.
In addition to RLI and Great American, other top performers included commercial lines writer W. R. Berkley Corp. and Trupanion. Assurant Inc., the US P&C subsidiaries of Fairfax Financial Holdings Limited, excess-and-surplus lines writer James River Group Holdings Ltd., the US subsidiaries of Bermuda-based reinsurer PartnerRe Ltd. and specialty insurer and reinsurer Arch Capital Group Ltd. were also in the top 10.
Methodology
To determine the performance scores of the individual P&C groups, we calculated the mean results for each of the 13 performance metrics, then determined each company's deviation from those means. The deviation from the mean was standardized using a Z-test so the different metrics chosen could be compared. To minimize the effect of outliers, we set a range limiting the amount of deviation recorded for each company. The metrics reflect consolidated statutory financials for each group, which are limited to US-domiciled entities that file annual statements with the National Association of Insurance Commissioners.
The 13 weighted deviations then were added together to calculate a final score. The final scores were then ranked from highest to lowest for the 50 companies.
In addition to the 35% weighting assigned to rates of return, we applied the following weightings to the other five buckets: 30% to underwriting profitability, which includes the loss and LAE ratio adjusted for reserve development, and operating ratio; 15% to asset and surplus growth; 10% to investment performance was weighted 10%; and 5%, apiece, to reserve development and premium growth.
The respective weightings with a heavy emphasis on returns and underwriting profitability reflect our view that strong earnings represent the most important measure of a company's performance. Our weightings deemphasize investment results. This was particularly meaningful in 2022 as volatility in the equity and fixed income markets stemming from Federal Reserve interest rate policy created significant headwinds, with 41 of the 50 companies showing negative ratios of net changes in unrealized capital gains and losses to average capital and surplus. The other metrics contributing to the investment results bucket include growth in investment income, the net yield on invested assets and the ratio of realized capital gains and losses to average surplus.
Companies deemed to have an accident-and-health or commercial financial lines focus are excluded from this analysis.
Our interactive template allows users to adjust weightings for each of the six buckets to emphasize or deemphasize particularly categories. Scores generated by the template may differ from those referenced in this article due to the receipt of new statutory financial information and/or revisions to our group structures.
This article was published by S&P Global Market Intelligence and not by S&P Global Ratings, which is a separately managed division of S&P Global.