Featured Topics
Featured Products
Events
S&P Global Offerings
Featured Topics
Featured Products
Events
S&P Global Offerings
Featured Topics
Featured Products
Events
S&P Global Offerings
Featured Topics
Featured Products
Events
Financial and Market intelligence
Fundamental & Alternative Datasets
Government & Defense
Banking & Capital Markets
Economy & Finance
Energy Transition & Sustainability
Technology & Innovation
Podcasts & Newsletters
Financial and Market intelligence
Fundamental & Alternative Datasets
Government & Defense
Banking & Capital Markets
Economy & Finance
Energy Transition & Sustainability
Technology & Innovation
Podcasts & Newsletters
2 Feb, 2016 | 08:00
The S&P 500’s decline in January ranks it among the worst 1/3rd of all returns in January since 1945. Does such a bad start imply that the 500 is likely to record a decline for the entire year? History shows that whenever the S&P 500 fell by 4.6% or more in price in January, the market declined an average 6.1% for the full year.
However, history is a great guide, but it’s never gospel. Indeed while the full year saw a decline 67% of the time after a negative start, the remaining 11 months recorded a price increase more than 50% of the time. So while the dour start is discouraging, a rest-of-year decline is far from certain.
“As Goes January, So Goes the Year” is an old Wall Street saying that indicates whether investors are confident or confused about the outlook for stocks over the remainder of the year. The adage, popularized by The Stock Trader’s Almanac, implies that if the S&P 500 rises in price in January, it will continue to rise for the rest of the year, and vice versa. Despite a negative start to 2016, investors may still be able to turn lemons into whiskey sours.
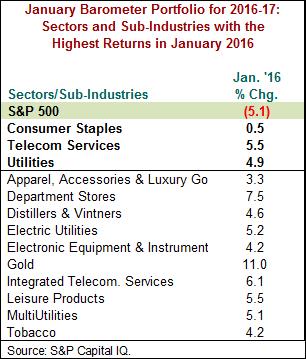
Since 1990, while the S&P 500 posted a 12-month (January 31 to January 31) compound annual growth rate (CAGR) of 7.1%, an equal weighting of the three best performing S&P 500 sectors in January, held until the end of the following January, posted a CAGR of 8.7%. Better yet, the 10 best performing sub-industries in January jumped an average 14.6% in the subsequent 12 months.
