Featured Topics
Featured Products
Events
S&P Global Offerings
Featured Topics
Featured Products
Events
S&P Global Offerings
Featured Topics
Featured Products
Events
S&P Global Offerings
Featured Topics
Featured Products
Events
Financial and Market intelligence
Fundamental & Alternative Datasets
Government & Defense
Banking & Capital Markets
Economy & Finance
Energy Transition & Sustainability
Technology & Innovation
Podcasts & Newsletters
Financial and Market intelligence
Fundamental & Alternative Datasets
Government & Defense
Banking & Capital Markets
Economy & Finance
Energy Transition & Sustainability
Technology & Innovation
Podcasts & Newsletters
EQUITIES COMMENTARY — Apr 08, 2021

By Sam Pierson
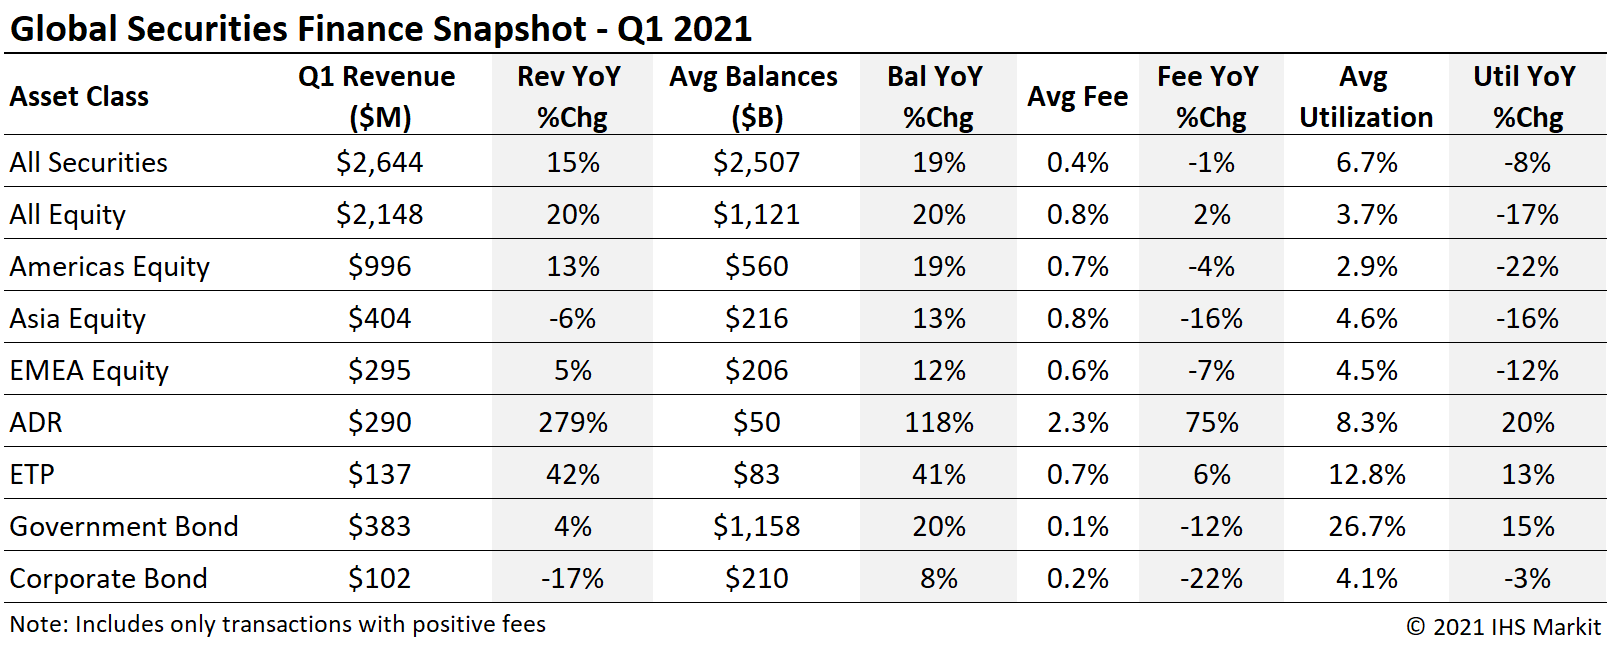
Global securities finance revenues totaled $2.6bn for Q1 2021, a 15% YoY increase. Returns increased 11% sequentially, as compared with Q4 2020. The new year came out of the gate at a sprint pace, with the short squeeze in US equities and soaring borrow demand for USTs. Growth in fixed income borrow demand extended to corporates and exchange traded products as well. Global lendable assets reached a record high in Q1, $30T, while loan balances reached a post-GFC high of $2.7T.
APAC Equity
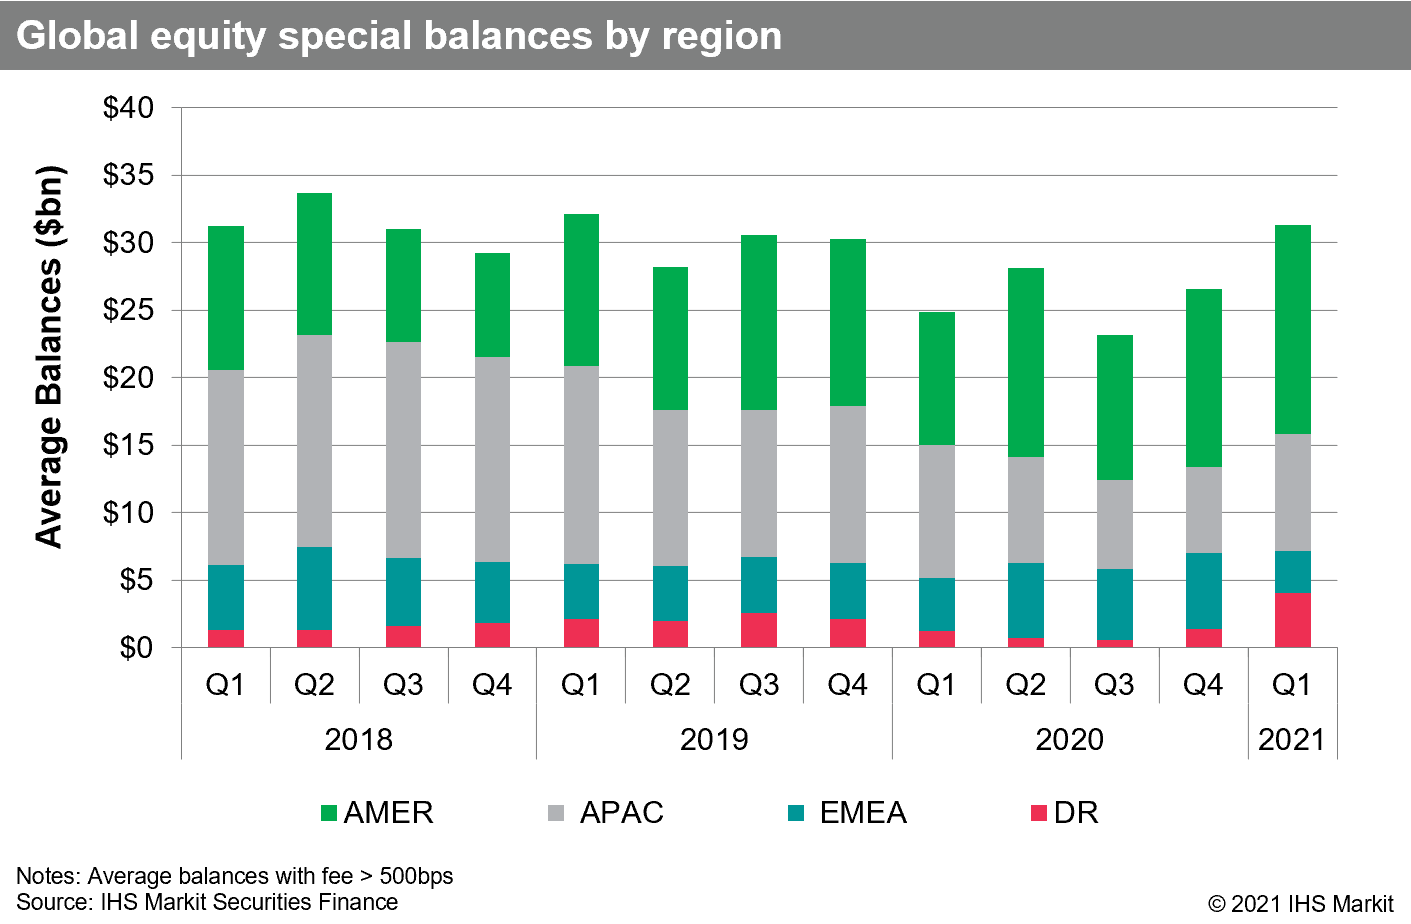
APAC equity finance revenues of $404m reflect a decline of 6% YoY; however, the trend is upward, with March posting a YoY increase of 4%. Daily average loan balances increased by 13% YoY while narrower fee spreads dragged on returns. Asia equity special balances averaged $8.7bn for Q1, an 11% YoY decline. The YoY comparison is materially impacted by the South Korea short sale ban, which is due to substantially conclude in May 2021. Compared with Q4 2020, APAC special balances increased 37% in Q1, reflecting a steady increase from the low point in November 2020. Special balances are defined in this note as balances with a fee greater than 500bps.
Depository Receipts
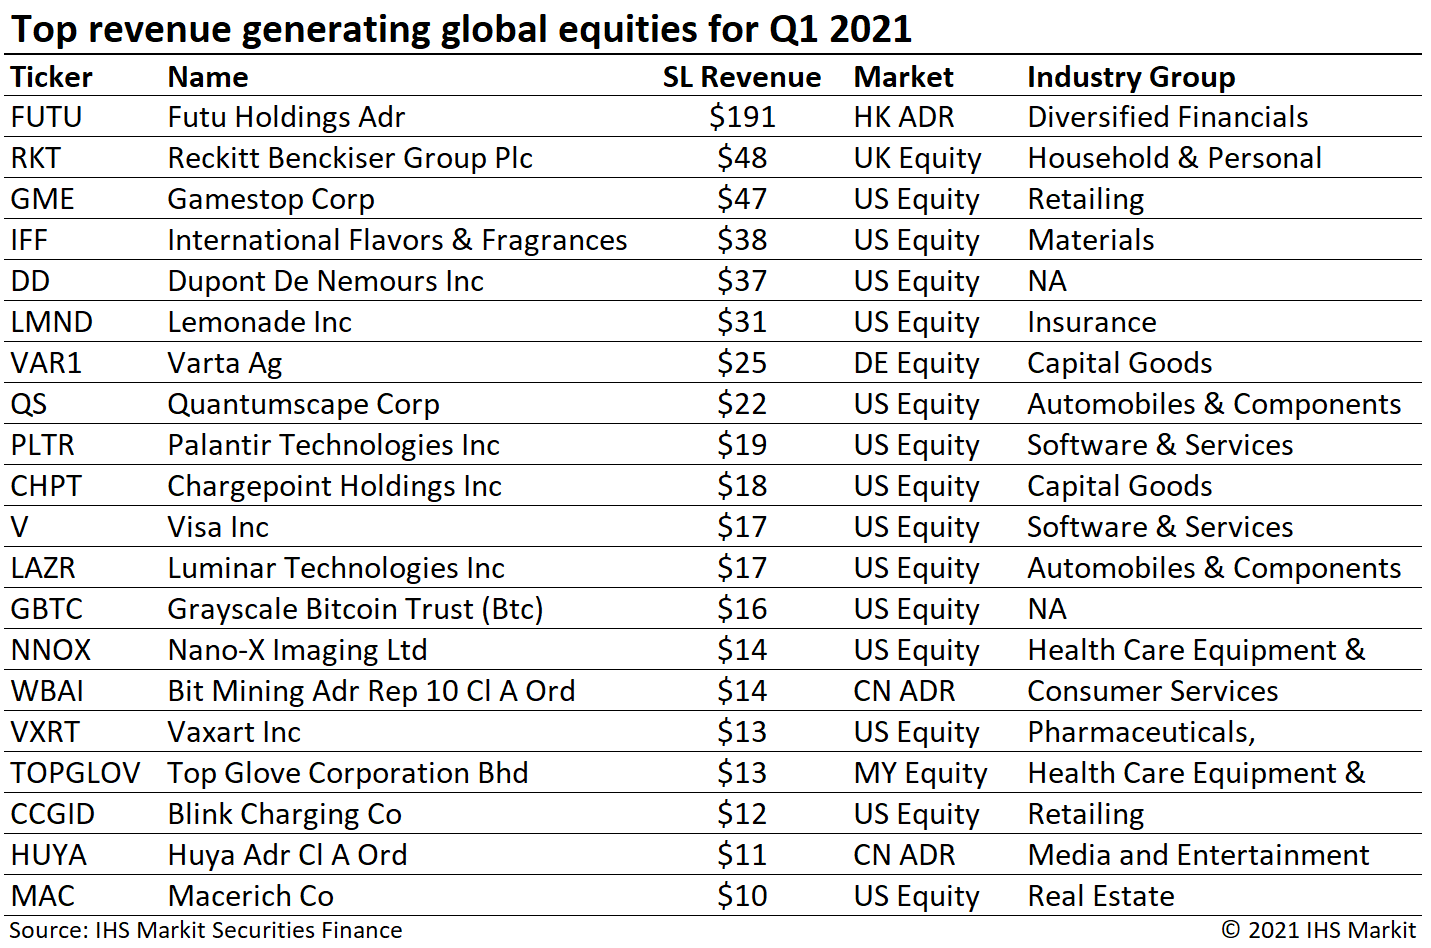
Revenues from lending American Depository Receipts (ADRs) increased 279% YoY for Q1. Most of the increase was driven by Hong Kong SAR domiciled Futu Holdings, which generated $191m in Q1, 66% of the total ADR return. Excluding the impact of Futu, Q1 ADR revenues increased 30% YoY. Depository receipts listed outside the US generated $16m in Q1, a 74% YoY increase.
Americas Equity
Revenues for Americas equities came in at $996m for Q1, a 13% YoY increase. Americas revenues declined 2% sequentially compared with Q4 2020. The YoY revenue increase in aggregate was the result of higher loan balances, though the quarterly aggregation belies substantial variation by month. In January, average fees were up 32% compared with 2020, while loan balances were up 13%, both reflecting the broad short squeeze for shares with elevated short interest. For March, the decline in special balances weighed on average fees by more than enough to offset the YoY increase in loan balances. Americas specials balances averaged $15.5bn for Q1, a 56% YoY increase, and 17% sequential increase compared with Q4 2020.
European Equity
European equity revenues came in at $294m for Q1, a 5% YoY increase. Revenues declined 17% sequentially compared with Q4 2020. The decline compared with Q4 2020 was impacted by the drop-off in balances following the January short squeeze, most notably including Varta Ag. EMEA specials balances averaged $3bn for Q1, a 22% YoY decline and 45% sequential decline compared with Q4 2020.
Exchange Traded Products
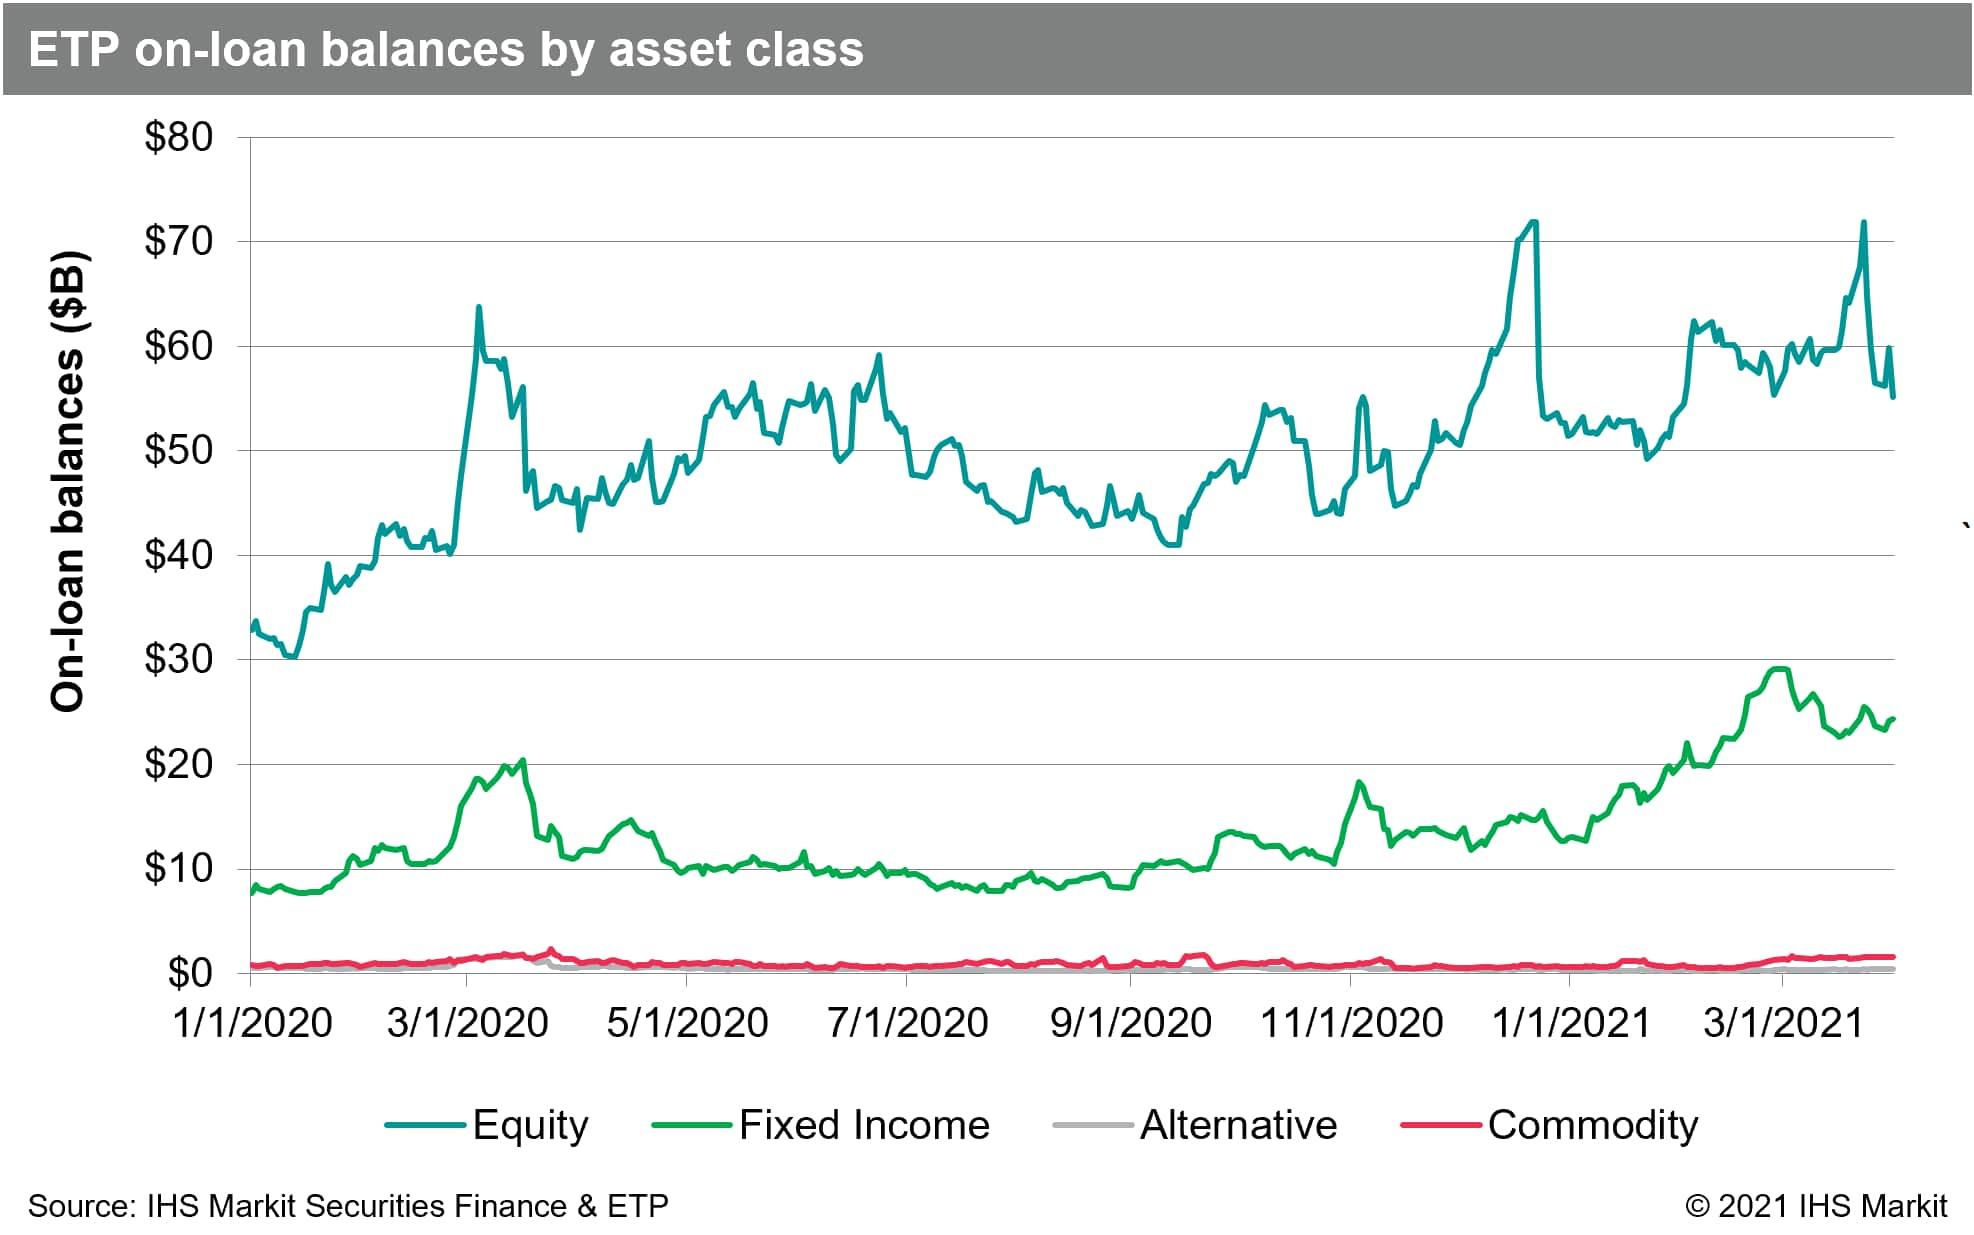
Global ETP revenues totaled $137m for Q1, the highest quarterly revenue ever recorded, representing a 42% YoY increase. Loan balances increased by 41% YoY, the largest contributor to revenue growth; however, average fees also increased 6% YoY. Loan balances reached a new all-time high on March 23rd, $102bn, with the final uptick to the record driven by Penn National Gaming & Caeser's Entertainment being added to the S&P 500. That narrowly edged out the prior record set in December when Tesla was added to the S&P 500. Fixed income products generated 27% of Q1 ETP revenues, up from 18% for FY 2020.
Corporate Bonds
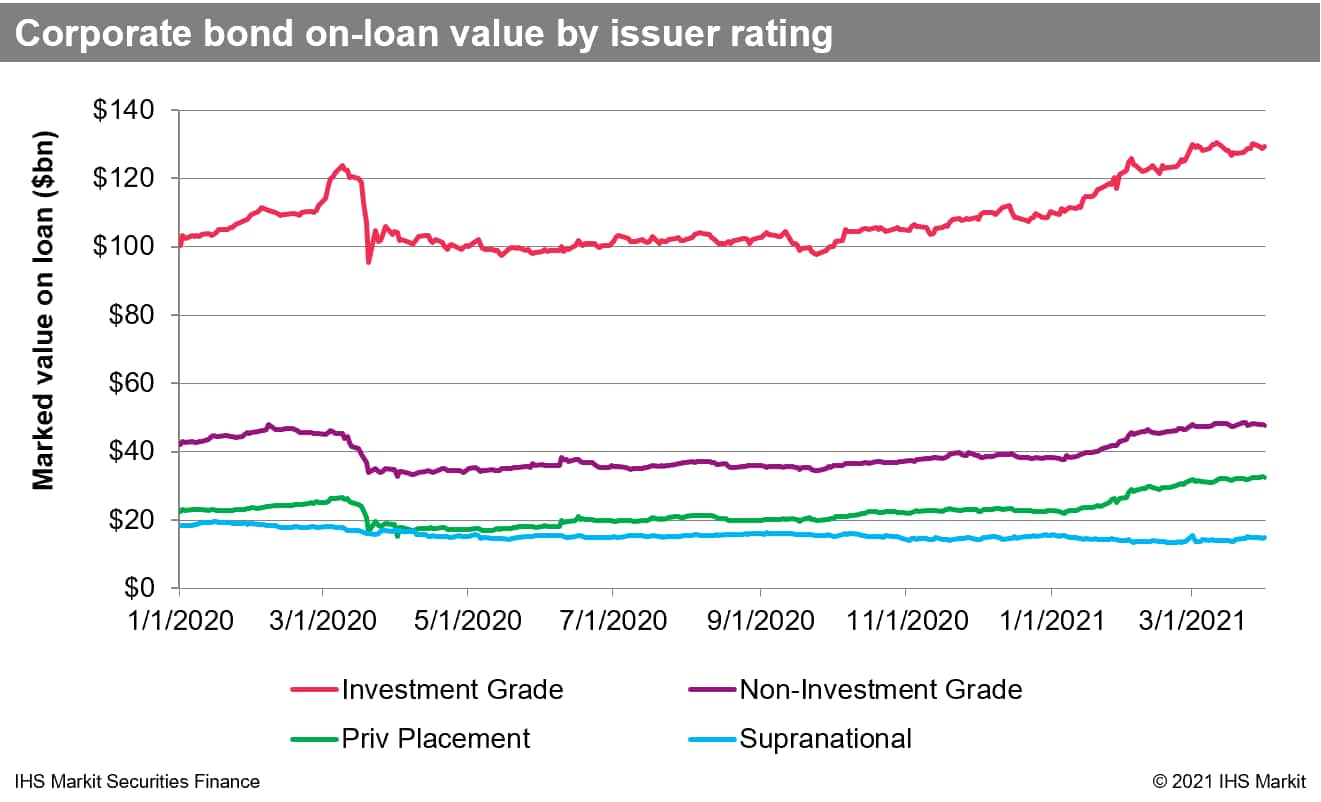
Corporate bond lending returns came in at $36.3m for Q1, a 17% decline YoY. The YoY comparisons continue to be driven by narrower fee spreads, with global loan balances with positive spreads reaching a post-GFC record, $225bn, during the last week of the quarter. Lendable assets reached an all-time high in December, though declining valuations for investment grade corporates drove lendable value lower in Q1.
Government Bonds
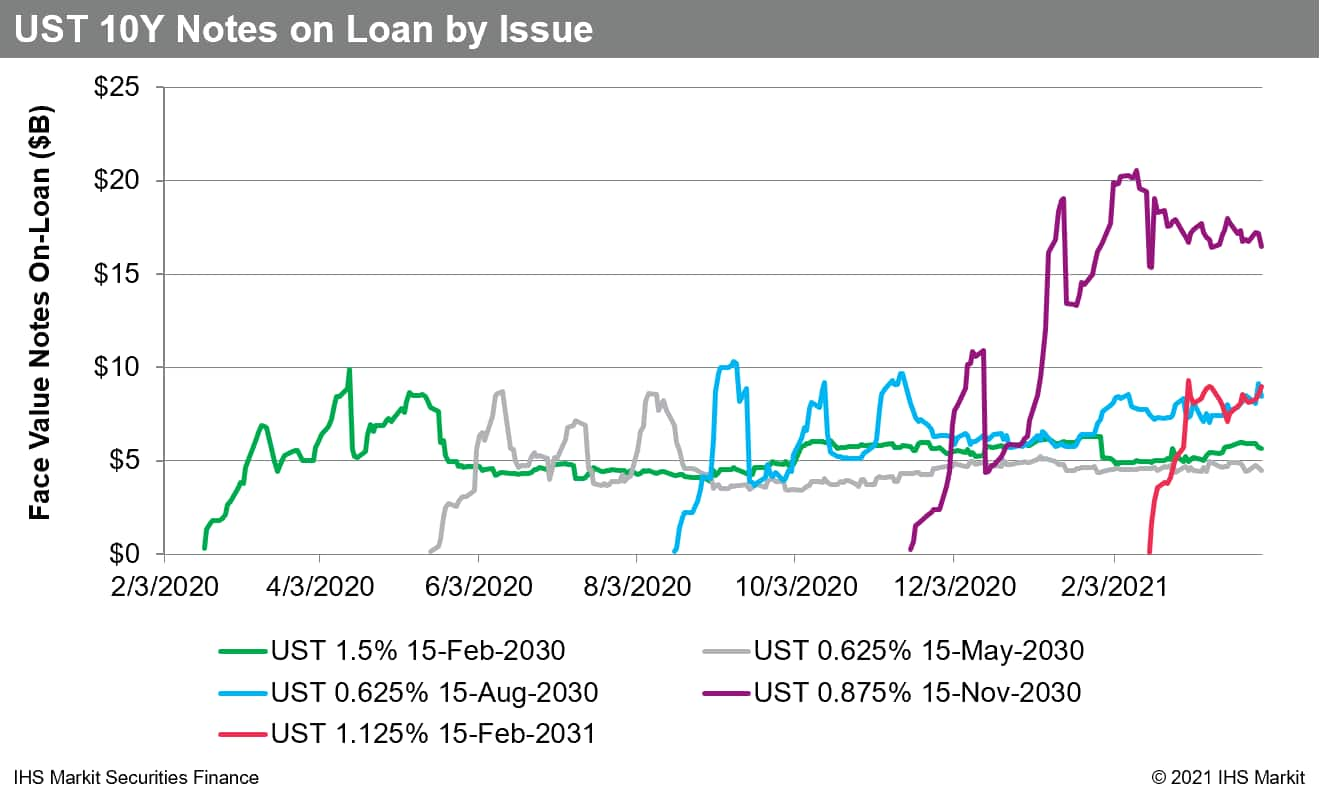
Government bond borrow demand remains robust, with nearly $1.2T in average positive-fee global balances for Q1 reflecting a 20% YoY increase. Revenues totaled $383m in Q1, a 4% YoY increase. US government bond lending revenue came in at $230m for Q1, a 7% YoY increase. The most revenue generating bond was the 10Y due Nov 2030, which saw substantially greater loan balances than prior 10Y notes. The UST 10Y due Feb 2031 delivered a revenue uplift in March, trading special for longer than prior issues, albeit with lower loan balances than the Nov 2030 note.
Conclusion
If the year 2020 felt like a decade, Q1 2021 was a lifetime. The short squeeze in January drove the most monthly equity finance revenue on record for US equities. Equity special balances ended the quarter well below the January peak, however a positive a signal is found in the relative underperformance of crowded US equity short positions in February and March; Specials balances declining because the trades are delivering alpha may boost future demand. Beyond directional short demand, corporate actions and capital raising, the latter including SPAC business combinations, are likely to boost demand going forward, along with the resumption of dividends halted or reduced in 2020 and the anticipated conclusion of the remaining short sale bans. Trading in fixed income products picked up with renewed vigor in Q1, as global growth expectations ratcheted up substantially. Borrow demand for investment grade credit also received a tailwind from the rates volatility. Varying expectations about the course of action for the Federal Reserve, inflation and economic growth appear likely to persist into the remainder of 2021. Tying the themes together, as often they do, exchange traded products saw soaring demand for credit, rates & equities in a record setting quarter.
S&P Global provides industry-leading data, software and technology platforms and managed services to tackle some of the most difficult challenges in financial markets. We help our customers better understand complicated markets, reduce risk, operate more efficiently and comply with financial regulation.
This article was published by S&P Global Market Intelligence and not by S&P Global Ratings, which is a separately managed division of S&P Global.