Featured Topics
Featured Products
Events
S&P Global Offerings
Featured Topics
Featured Products
Events
S&P Global Offerings
Featured Topics
Featured Products
Events
S&P Global Offerings
Featured Topics
Featured Products
Events
Financial and Market intelligence
Fundamental & Alternative Datasets
Government & Defense
Banking & Capital Markets
Economy & Finance
Energy Transition & Sustainability
Technology & Innovation
Podcasts & Newsletters
Financial and Market intelligence
Fundamental & Alternative Datasets
Government & Defense
Banking & Capital Markets
Economy & Finance
Energy Transition & Sustainability
Technology & Innovation
Podcasts & Newsletters
BLOG — Nov 11, 2021
Container shipping has never been as much under the spotlight as this year. Freight had been keeping flat for several years. One debating question could be whether there's a shortage in container shipping capacity or it is more of a misplacement in supply and demand, the answer of which might be a factor for the long-term market outlook.
Looking back for a decade, momentum in placing orders seems are in pace with global containerised trade dynamics, with some synergy in ordering activity peaks among top operators. Though cancelling is not an unusual practice with higher cancelling seemingly after weaker trade years.
Looking ahead, trade forecasting vs. newbuilding twining with decarbonisation initiative, emerging alternative fuels together may shape the market beyond traditional supply and demand.
For shippers, shipyards and carriers, keeping up with the latest Trade Forecast, particularly trade volume en route deployable markets is critical when placing ship orders; for equipment vendors, following the trend of fleet and builders or owners' ordering preference is a way for business and trade development; financial institutes may need such market due diligence to evaluate the investment in commercial and sustainable sense.
Containership ordering has experienced both highs and lows in the past decade. Following the global financial crisis in 2008/2009, there were only 132 orders placed with an aggregated capacity of 643K TEU in 2010. The number climbed in the following years reaching a short-term peak in 2015, when 440 vessels were ordered amount to 3.19 million TEU (though not all delivered). The size segmentation also shows the attitude where larger vessels (e.g. New and Post Panamax) were taking increasing part on orderbook.
However, this momentum was suddenly lost in 2016 and this has lasted until this year - when the activeness bounced back in the middle of a freight boom.
If combined looking at trade in the past decade, movements in Containerised trade volume, freight level and ordering activities seem to be in tandem. - though ordering could have some time lag.


Many of those placing orders are familiar to shippers, among top operators, Evergreen and MSC operate 201 and 168 ships, taken up 13% and 18% respectively in terms of total TEU - though apparently average size of the two operators varied. They are followed by COSCO/OOCL, CMA CGM and Maersk. Some regional shipping lines. Wan Hai and SITC, also are placing significant new orders, though seems to be in smaller segments.


On a year basis, these major players shows some orchestration in ordering activity - relatively silent both in terms of fleet expansion and number of players after 2015, reflecting the more or less pessimistic market condition during this period; but this year 2021, another ordering boom is happening.

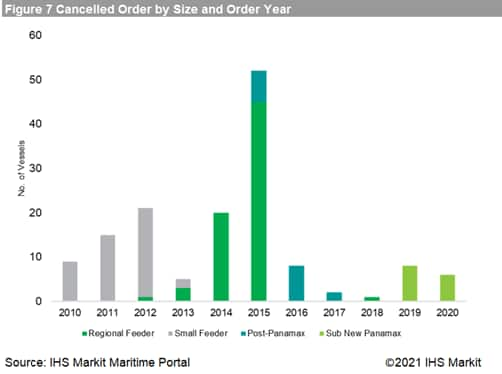
When you come to the question whether all these placed orders actually went into service? Unfortunately not. While 2015 was a busy year in terms of ship ordering, the cancelled number is also significant - more than 50 ordered containerships never went into creation - and the majority fall under the Post-Panamax segment.

In terms of cancel timing, the heatmap shows that majority of cancelled ships were to be delivered in 2018 but finally called back in 2016. For shipbuilding yards, this could bring some challenges too. Though mainland China shipyards have the largest market share in the past decades, 15% - 20% of cancelling rate seemed frequent.


As we could imagine that 'cancelling' would possibly be a message of pessimistic outlook for container shipping demand - at least expected lower growth rate. By comparing the cancelling rate against Global seaborne containerised trade volume (TEU) - whether ordering ships be a lag indicator or the other way. Though each may hold opinion in it's own right. From the cancelling rate and world container trade perspective, in quite a few cases, coincidently a year with lower growth rate (or even negative) seemed to lead to a higher possibility that orders in the following year to be cancelled, and vice versa. What is yet to be seen is with a negative growth in 2020 trade and intense ordering activities in 2021, whether the market will experience déjà vu of either 'too much' or 'never enough'.

It is important for either ship owners, or the shipyards, to have an in-time market size outlook, when placing or preparing for any further orders. This may concern the size of ship to be built, the planned deployment trade lane, and the construction or machinery specifications required for those markets and geographies.

With the current orderbook, a heavy delivery schedule is expected in the next three years - with a majority from VLCC (>10,000 TEU).
From the demand side, as latest GTAS Forecasting results show, "Going forward, the containerized trade is projected to grow by 2.8% on average per year for 2021-35. Head haul is estimated to have an impressive expansion of 3.7% in 2021 and a more moderate 1.5% growth in 2022. while backhaul trade projections for 2021 point to a minor increase of 0.6%. Moving forward, our forecasts suggest that growth on the backhaul routes will amount to 2.4% per year for 2021-35."

However, apart from the conventional thinking model of 'supply vs. demand', we now count in more factors when understanding the market ahead. Regulatory and industry initiatives on Decarbonisation, alternative fuel, renewable energy with emerging technologies are also variables and driving forces.
Looking back at orders placed in the decade from a fuel angle. LNG Fuel was insignificant in containership orders, merely emerging around 2016, but in recent years alternative fuel containerships are increasing in share. The structure of fuel type by status shows a higher percentage of new building fleet than in service. In 2021 till now, at least 68 Alternative Fuel orders are placed (excluding another 77 vessels fuel type to be confirmed).


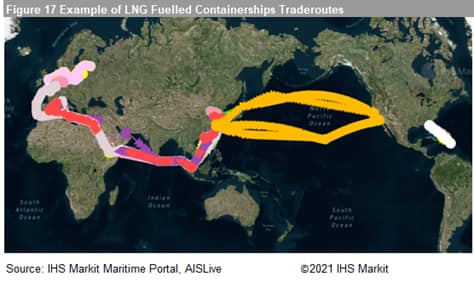
Tracking those already in service LNG Fuelling containership, we can find these are almost all deployed on Trans-pacific and Eurasia trade routes - in 2020 containerised volume delivered among North America, Europe and East Asia, stood at 63 million TEU; with forecasted 81 million toward 2030 by which the decarbonisation target was set to be achieved.


The deployment may also linked to ship size where we noticed alternative fuels are in favour of larger containerships, possibly expect better compliance under current sustainability agenda. Major container shipping lines are leading the way with CMA CGM with 39% of TEU capacity in all alternative fuel containerships expected.

For more insight subscribe to our complimentary commodity analytics newsletter
Posted 11 November 2021 by Yingzhi Zhang, Subject Matter Expert, Maritime,Trade & Supply Chain, S&P Global Market Intelligence
How can our products help you?
