Featured Topics
Featured Products
Events
S&P Global Offerings
Featured Topics
Featured Products
Events
S&P Global Offerings
Featured Topics
Featured Products
Events
S&P Global Offerings
Featured Topics
Featured Products
Events
Financial and Market intelligence
Fundamental & Alternative Datasets
Government & Defense
Banking & Capital Markets
Economy & Finance
Energy Transition & Sustainability
Technology & Innovation
Podcasts & Newsletters
Financial and Market intelligence
Fundamental & Alternative Datasets
Government & Defense
Banking & Capital Markets
Economy & Finance
Energy Transition & Sustainability
Technology & Innovation
Podcasts & Newsletters
ECONOMICS COMMENTARY — Sep 15, 2023

By Joseph Hayes
We have previously highlighted ways in which financial market participants can use PMI data to extract valuable investment signals (see here, here and here). In this paper, we introduce a new method to demonstrate how an active rules-based approach, based on "investment factors", can generate excess returns for equity market investors across different time horizons.
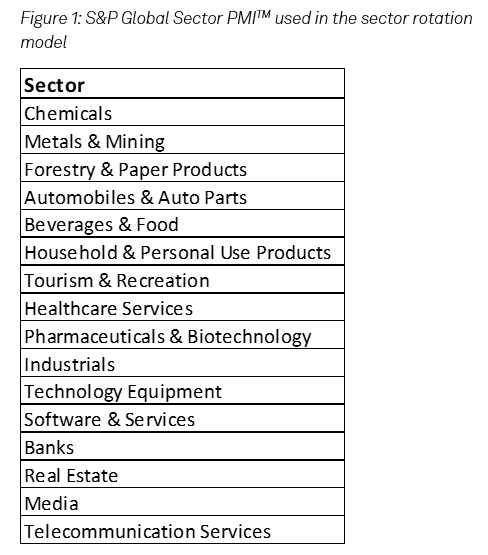
For this exercise, we use S&P Global Sector PMI data, which provides insight into business conditions in over 30 sectors with granularity down to three distinct tiers. Using 16 sectors and mapping them to the appropriate index within the MSCI universe, we establish a sector rotation model which uses signals identified from the Global Sector PMI to direct a hypothetical long-only portfolio. We find that, over both a five- and ten-year investment horizon, our approach generated sizeable excess returns over the benchmark MSCI World Index.
The philosophy explored here takes inspiration from factor investing, which selects assets and securities based on specific characteristics associated with excess returns. Simply put, we use the Global Sector PMI to identify which parts of the economy are performing the strongest on either a growth or momentum basis. Sectors are then scored based on their performance in each factor and investment is based on whether its score meets a certain threshold. This rules-based approach means the investment decisions are wholly derived from the movements in underlying PMI data each month.
The consistent methodology employed by the PMI surveys makes these datasets the ideal candidate for creating cross-sector investment strategies.
PMI data are presented as diffusion indexes, with values varying between 0 to 100 with 50 denoting no change on the prior month. Typically, they exhibit less volatility than comparable data series released by official statistics bodies, and have an excellent track record of pinpointing the position of a specific country or sector along the business cycle.
Speed of publication means the PMIs will be the first set of economic data to indicate turning points in the economic cycle, information which is of considerable value for investment-making.
In addition, PMIs are not revised after first publication, providing an additional layer of confidence in decision-making. Crucially, given the timely release cadence, business conditions are tracked in near real-time, meaning economic performance can be better understood, which is of critical importance to forward-looking financial markets.
We use 16 industries from the S&P Global Sector PMI , listed in figure 1. These sectors have been mapped to the appropriate group within GICS® to identify which MSCI Index will best capture the equity market performance of companies in that specific sector. For example, the MSCI Chemicals Index has been used to calculate equity market returns in the Chemicals sector.
The investment process is as follows. Upon the release of Global Sector PMITM data, the sector rotation model can be updated to indicate which sector(s) exhibit the strongest buy signal. Returns are realised after a pre-determined holding period. In this exercise, we experiment with one-, three- and six-month holding periods. In other words, if we invest in a sector on month t, we will stay invested until either month t+1, t+3 or t+6, when returns are then realised. The funds are then reinvested, and we reinvest 100% of the funds every month on the day the Global Sector PMITM are released in accordance with the signals from the sector rotation model. If more than one sector receives an investment signal, the funds are equally split between the sectors.
Our approach takes inspiration from factor investing, a popular investment strategy which identifies assets based on specific characteristics associated with excess returns. We focus on two factors determined by PMI data: growth and momentum.
i) Growth
The absolute value of the PMI Output Index is a powerful metric and tells us whether a sector is currently growing or shrinking, and what the speed of growth or contraction is. Any sector with an above-50.0 reading of its Output Index has a growth signal. As we are interested in finding the sectors which exhibit the strongest growth, we rank sectors by how far the Output Index has risen above the 50.0 level. The sector with the highest rank will therefore have recorded the fastest rate of growth in a given month.
ii) Momentum
Our momentum indicator is crafted by taking the latest reading in the Output Index and subtracting the average reading over a certain number of previous months. We experiment with two different momentum indicators, subtracting the latest Output Index reading from its averages over the prior three and six month periods. If the value for a given month is greater than its trailing three- or six-month average, the sector has a momentum signal. We then rank sectors on these metrics: the further above zero, the stronger the momentum signal.
The Output Index is of vital importance to understand how activity levels in a particular industry are changing month-to-month and, in turn, which sectors are best poised to generate positive investment returns. That said, the sector's position in the business cycle also needs to be considered.
For example, let's assume the Output Index for Chemicals recorded 55.0, but in the previous two months it recorded 75.0 and then 65.0. Taking the latest month's index reading in isolation would lead to the conclusion that the global Chemicals output is growing strongly (which is true). However, the index has fallen by 20 points in two months, indicating a considerable loss of growth momentum and a warning that conditions in the Chemicals sector may soon worsen. Such information could plausibly lead to an adverse reaction in chemical stocks.
Conversely, assume the Metals & Mining Output Index recorded 49.0, but in the previous two months it recorded 47.0 and 45.0. From these readings one will infer that the sector is close to stabilising after a downturn, and now may be a good opportunity to invest in the sector, given it is close to growth. This analysis is of paramount importance in an investment context, particularly given the necessity for financial markets to be forward-looking, as recoveries in equity prices occur before changing fundamentals are confirmed by less timely data such as official industrial production or GDP data.
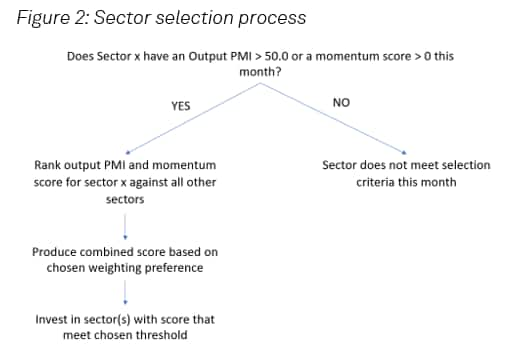
There are two parts to the sector selection process. First, we assess if a sector's Output PMI has recorded above 50.0, and/or its momentum score is positive. Next, if at least one of these criteria is fulfilled, those sectors with scores which meet our rule are invested into. The scores are determined by a sector's rank on both its Output PMI and its momentum. For simplicity, we have opted to split funds equally across sectors when more than one sector meets our criteria, instead of utilising a weighting system based on the strength of the buy signal.
We create two models, Model A and Model B. In both models, an Output PMI reading above 50.0 must be fulfilled, however in Model A, we use the six-month momentum indicator, whereas in B we use the three-month momentum indicator. We test with these two different momentum gauges to assess the extent to which limiting the window of data included impacts our investment decisions. Deriving investment signals from data over a longer history may dilute the recent, and arguably more important, signals. In Model B, we also raise the score required to be selected. While this means the model becomes less diversified (and increases risk as less sectors are now eligible for selection), it does help to ensure that funds are allocated to sectors with the strongest buy signal.
For each model, we also experiment with applying different weights to sector growth and momentum scores. We test with three different weighting procedures, detailed in figure 3 below.
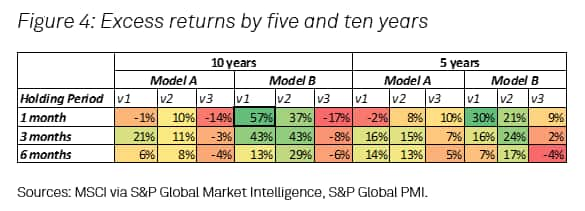
The results of our sector rotation models over a five- and ten-year time horizon are illustrated in figure 4. Overall, the best-performing sector rotation model used the most stringent scoring threshold, equally weighted growth and momentum signals and used three-month momentum as opposed to six-month momentum (Model B V1).
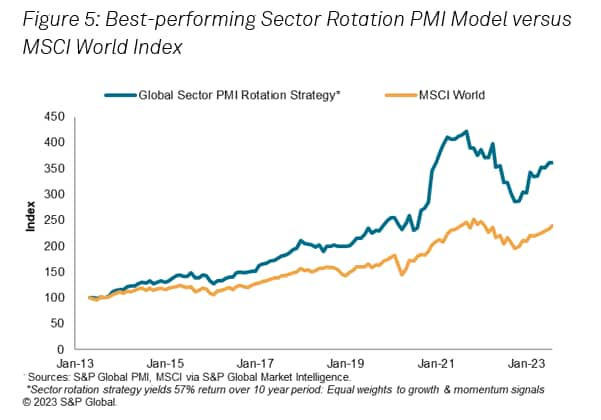
We found notable differences in excess returns when experimenting with different weighting systems. Applying equal weights to the growth and momentum score yielded the largest excess returns over both a five- and ten-year investment horizon. Using a one-month holding period, we were able to achieve 57% excess returns over the benchmark MSCI World Index across a ten-year period (see figure 4 and figure 5), and 30% over five years. Strong excess returns were also achieved using both three- and six-month holding periods.
Applying a 100% weight to the growth score also led to strong excess returns across both Model A and Model B, although returns were generally below the benchmark when a 0% weight was applied to the growth score. The absolute value of the Output Index therefore carries a significant role in our sector rotation model.
The spread of returns over different holding periods is also an intriguing finding. One- and three-month holding periods tend to outperform six months across both model types and the three different weighting systems, although strong excess returns were nevertheless registered in all three holding periods.
It's worth noting that, while our approach has allowed us to generate stronger excess returns, our portfolio lacks diversification. This explains why the model underperformed the benchmark significantly during periods of stock market turmoil, such as in 2022. At the same time, periods of strong equity market performance coincide with aggressive outperformance using our sector rotation strategy, showcasing the ability of the PMI to determine the best sectors driving the market.
We have shown how S&P Global Sector PMI data can be used by equity market participants to generate excess returns. By creating an active rules-based sector rotation model, where investment decisions are wholly determined by movements in our PMI datasets, we have been able to generate excess returns as large as 57% over a ten-year period. In this exercise we focused on the PMI Output Index, but we recommend users to consider the inclusion of other indices within the PMI universe such as the New Orders Index and Backlogs of Work Index, or combinations of more than one index. We have had success in blending indices before, such as using a combination of PMI sub-indices like Output, New Orders and Prices Charged.
Experimenting with different rules and scoring tolerances could also help investors find additional alpha. In our example, we invested equally into sectors which exhibit a buy signal and did not discriminate between sectors that meet our scoring threshold. Weights could instead be applied based on the strength of buy signals, providing greater opportunity to invest more heavily in sectors likely to outperform, based on PMI data.
The weighting system we have employed for our growth and momentum signals are also by no means exhaustive, and we'd encourage the testing of alterative weighting systems.
Joe Hayes, Senior Economist, S&P Global Market Intelligence
Tel: +44 1344 328 099
joseph.hayes@spglobal.com
© 2023, S&P Global. All rights reserved. Reproduction in whole or in part without permission is prohibited.
Purchasing Managers' Index™ (PMI®) data are compiled by S&P Global for more than 40 economies worldwide. The monthly data are derived from surveys of senior executives at private sector companies, and are available only via subscription. The PMI dataset features a headline number, which indicates the overall health of an economy, and sub-indices, which provide insights into other key economic drivers such as GDP, inflation, exports, capacity utilization, employment and inventories. The PMI data are used by financial and corporate professionals to better understand where economies and markets are headed, and to uncover opportunities.
This article was published by S&P Global Market Intelligence and not by S&P Global Ratings, which is a separately managed division of S&P Global.


