Featured Topics
Featured Products
Events
S&P Global Offerings
Featured Topics
Featured Products
Events
S&P Global Offerings
Featured Topics
Featured Products
Events
S&P Global Offerings
Featured Topics
Featured Products
Events
Financial and Market intelligence
Fundamental & Alternative Datasets
Government & Defense
Banking & Capital Markets
Economy & Finance
Energy Transition & Sustainability
Technology & Innovation
Podcasts & Newsletters
Financial and Market intelligence
Fundamental & Alternative Datasets
Government & Defense
Banking & Capital Markets
Economy & Finance
Energy Transition & Sustainability
Technology & Innovation
Podcasts & Newsletters
Research — 8 Jun, 2022

By Adam Wilson
Introduction
The Southwest Power Pool (SPP) territory is located right in the center of the continental U.S. and is home to some of the strongest average wind speeds in the country. This, combined with generally flat, sparsely populated land has made the SPP a region of focus for wind developers despite the broad lack of aggressive state renewable policy. The SPP ranks fourth among the U.S. regions designated in our wind investment outlook in the U.S., with over 29 GW of operating wind capacity. The financial outlook for wind in the SPP is among the most favorable in the country, boding well for the planned 16 GW of wind capacity in the pipeline in the SPP.

Wind is the dominant clean energy technology in the SPP, with more than 29 GW of operating capacity compared to a modest 185 MW of solar. The region ranks fourth in operating wind capacity among the five regions outlined in this report, but only 900 MW separate the SPP and the Midcontinent ISO.
Despite a broad lack of mandatory renewable energy portfolio standards, or RPS, wind generation accounts for between 25% and 44% of total state generation in the SPP, driven by some of the highest performing wind projects in the country — the SPP is home to the top four states in average wind capacity factor.
Another 16 GW of wind development is planned in the SPP, though the region is one of the least populated and has relatively low overall demand. Even with no mandatory state renewable targets, the region's strong wind resources, cheap land and the availability of the federal production tax credit provide profit opportunities for developers.

Regional overview
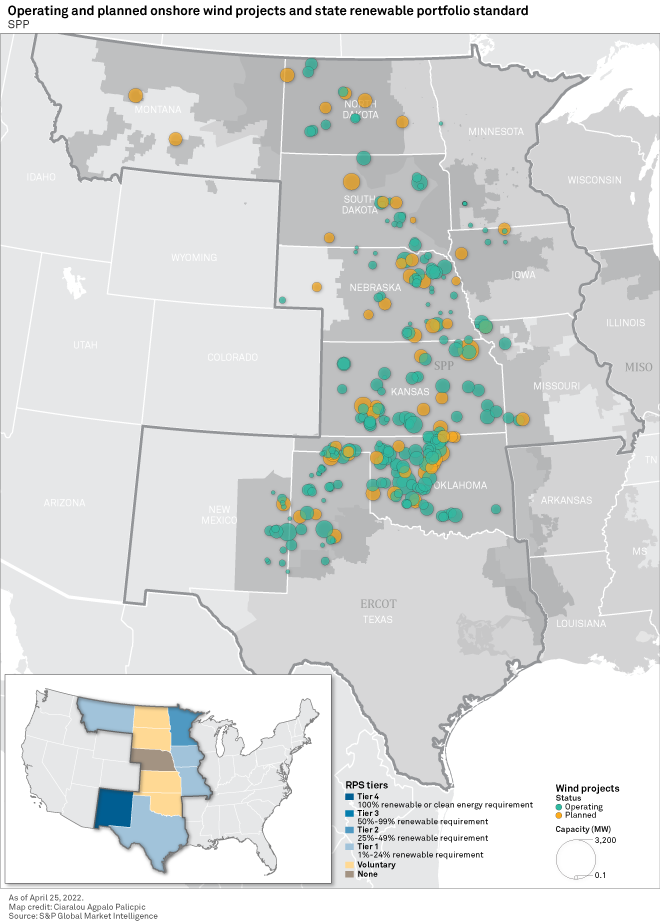
The SPP interconnection stretches from southeast New Mexico and the Texas Panhandle up through portions of North Dakota and Montana. There are 14 states at least partially within the SPP's footprint, but the primary states include Kansas, Nebraska, Oklahoma and South Dakota. All, or at least the significant majority, of the load in these states fall within the SPP's jurisdiction. All have formidable installed bases of wind, ranking between third and 16th in the U.S. in operating wind capacity. Combined, these four states have over 26 GW of wind capacity in operation.
Adding to the list of shared characteristics among these four states is legislative support, or lack thereof, for renewables. None have a mandatory RPS, though Kansas, Oklahoma and South Dakota do have voluntary targets in place of 20%, 15% and 10%, respectively. These nonbinding renewable targets have all been surpassed as wind generation alone accounted for 35%-44% of the annual electricity generated in these three states as of 2020. Nebraska has no standard for renewable generation; however, the Nebraska Public Power District, the Omaha Public Power District and the Lincoln Electric System, the three largest energy providers in the state, have all set net zero-emission goals by 2050 or sooner. Wind comprised a quarter of the electricity generated in Nebraska in 2020.
State-level policy is, at best, a minor driving force for renewable development in SPP states. High average wind speeds, abundant cheap, flat land and the federal production tax credit have proven to be sufficient drivers for wind development regardless of state-level legislative support. Oklahoma ranks third in the country, and Kansas fourth, in installed wind capacity, with 11.7 GW and 8.2 GW, respectively. South Dakota and Nebraska have nearly 6,700 MW of operating capacity between them.
Development interest continues in the SPP as the Oklahoma-to-South Dakota corridor has another 16 GW of proposed wind capacity in the pipeline. Nebraska leads all SPP states with just over 4.9 GW of onshore wind in development, which ranks fourth in offshore wind in the U.S. Oklahoma is close behind with 4.6 GW in the pipeline, ranking fifth. North Dakota, partially covered by the SPP as well as the MISO, has another 3.5 GW of wind in planning, though over half is expected to go into the MISO, according to S&P Global Commodity Insights data. Another 3.5 GW of wind across six states is planned to serve the SPP interconnection.

Nebraska
In late 2021, the board of directors of the Nebraska Public Power District, Nebraska's largest electric utility, voted to implement a nonbinding goal of net-zero emissions by 2050. The Nebraska Public Power District followed the lead of the Omaha Public Power District and the Lincoln Electric System, which committed to similar zero-carbon targets by 2050 and 2040, respectively. The targets by these utilities — all publicly owned — can serve as a proxy for a statewide renewable energy standard, as these energy providers cover the majority of the state's energy load. While coal power still accounts for over half of the state's power generation, wind development is increasing rapidly across Nebraska.
Nebraska ranks 16th in the country with 3.3 GW of operating wind capacity. In 2020, wind power accounted for 25% of Nebraska's total annual electricity generated. The state's impressive wind resources boost this figure. According to a Commodity Insights analysis, Nebraska wind farms had the highest combined average capacity factor at 44.6% in 2020. The state's largest wind farm, the 400-MW Grande Prairie Wind project owned by Berkshire Hathaway Inc. subsidiary BHE Renewables LLC, has consistently boasted capacity factors between 41% and 44% since its 2016 commissioning.
Developers are taking notice of the impressive performance of wind projects in the Cornhusker state as the pipeline for wind has swelled to 4,947 MW, ranking fourth in the country in planned onshore wind capacity. Over 40% of this capacity, however, is tied up in a single wind project still in early planning: the 2,000 MW Wildcat Ridge Wind Farm- Geronimo, which will be owned and operated by National Grid PLC subsidiary National Grid Renewables LLC.
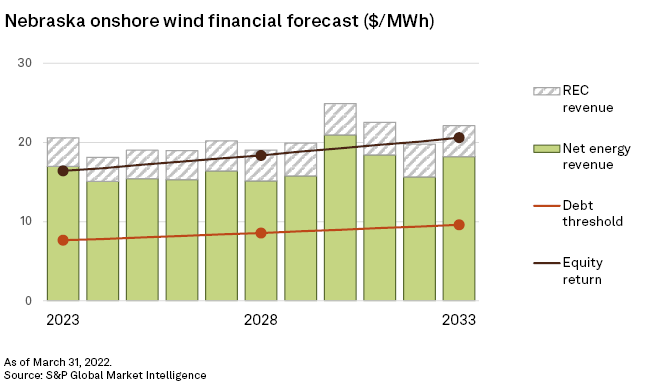
New wind projects in Nebraska face a favorable financial outlook, according to the 2022 first-quarter Power Forecast. Energy revenue is forecast to oscillate over the next decade, ranging between $15.11/MWh and $20.95/MWh. The minimum debt service threshold rises from $7.65/MWh in 2023 to $9.61/MWh by 2033, meaning energy revenue is more than sufficient for a wind project to meet its projected debt payment obligations. The target for a full equity return increases from $16.42/MWh in 2023 to $20.62/MWh in 2033. Energy revenue comes close to meeting this target in a couple of years and even surpassing it in 2030. The addition of voluntary renewable energy credit revenue pushes total revenue above the full equity return threshold throughout the decade.

Data from the Federal Energy Regulatory Commission's Electronic Quarterly Reports database shows that the clear trend of declining costs as contract rates for Nebraska wind farms have dropped from between $50-$60/MWh for contracts signed in 2010 or earlier to the low- to mid-teens per megawatt hour for more recent projects. The 90-MW Cottonwood Wind Generation Facility, owned by NextEra Energy Inc., signed contracts in 2017 for $15.60/MWh. NextEra also owns the 160-MW Sholes Wind Energy Center in Wayne County, which signed a contract with the OPPD in mid-2017 at a price of $13.25/MWh — right between the forecast near-term debt and full equity return targets in Nebraska.
Oklahoma
The Oklahoma Energy Security Act was enacted in 2010 and set a voluntary renewable energy target of 15% of the total installed generation capacity in the state to come from renewable resources by 2015. More than a quarter of Oklahoma's capacity in 2015 came from eligible resources, and wind alone accounts for 37% of the state's generation capacity. Oklahoma ranks third, just behind Iowa, in installed wind capacity with 11.7 GW.
With the state renewable energy goal already met and exceeded, development interest in Oklahoma remains strong, with over 4.6 GW of wind capacity in the pipeline — fifth in the country for proposed onshore capacity. Thanks to abundant wind resources — the state ranks fourth in average wind capacity factor at 41%. And with plenty of open land for development, wind interest in the Sooner state is not fading. There are 12 wind projects with a proposed capacity of 200 MW or more in planning in Oklahoma. The largest is Invenergy LLC's 600-MW Wagon Wheel Wind Project.
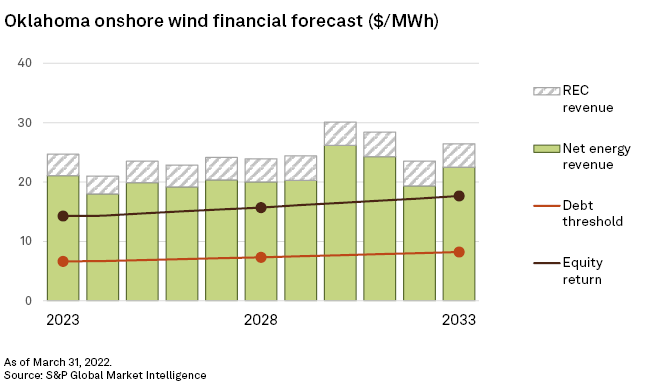
Looking at the financial outlook for wind in Oklahoma, it is no surprise that developers are looking to capitalize on the lucrative revenue potential in the state. Costs for wind in Oklahoma are among the cheapest in the country, with debt thresholds ranging from between $6.64/MWh and $8.23/MWh. Energy revenue is forecast to be enough to meet both debt and full equity return limits over the next decade. Forecast energy revenue varies between $17.99/MWh in 2024 and $26.16/MWh in 2030.

Electronic Quarterly Report contract rates for wind projects in Oklahoma for recently signed deals range from $15-$22/MWh. American Electric Power Co. Inc. subsidiary Public Service Co. of Oklahoma is the largest off-taker, along with OGE Energy Corp.. subsidiary Oklahoma Gas and Electric Co. The Public Service Co. of Oklahoma is the sole counterparty for the 200-MW Goodwell Wind Project operated by Enel SpA subsidiary Enel Green Power North America Inc. at a rate of $19.73/MWh as of fourth-quarter 2021. The 300-MW Balko Wind Project operated by EDF Renewables contracted two-thirds of its capacity to the Public Service Co. of Oklahoma for $17.27/MWh — aligning closely with the forecast full equity return rate by 2033.
South Dakota
Like Oklahoma, South Dakota has a voluntary RPS, which it has met and surpassed. Set in 2008, the target was 10% renewable generation by 2015. As of 2020, wind accounted for 41% of the total electricity produced in South Dakota. The state ranks 13th with 3.4 GW of operating wind capacity. Like its fellow SPP members, South Dakota has strong wind resources and cheap, undeveloped land, making it a desirable option for new wind projects.
There are just over 3.2 GW of wind capacity in the pipeline in South Dakota, ranking 10th in the country in planned onshore capacity. The Rushmore state ranks seventh in wind performance, according to 2020 data, with wind farms in the state averaging a 38% capacity factor. Solar is slowly making inroads in South Dakota with 338 MW of proposed utility-scale capacity, but wind remains the dominant renewable technology. There are 11 wind projects in development in South Dakota, of which six have a proposed capacity of at least 200 MW. The largest project in planning by far is the 1,430-MW Oceti Sakowin Wind Power Project (Phase 2) owned and operated by the Great Sioux Nation, an alliance of Native American tribes, with renewable energy veteran Apex Clean Energy Inc. as a partner.
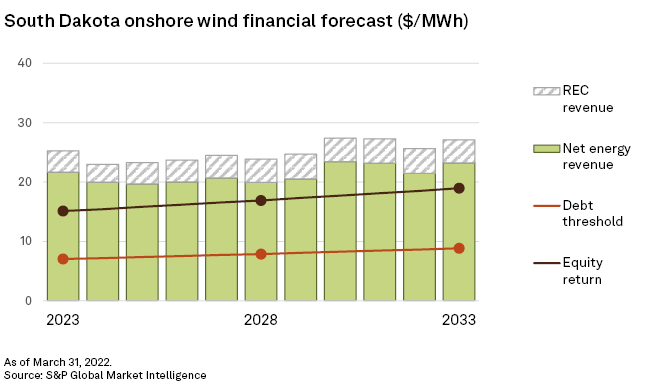
The financial forecast for wind in South Dakota is similar to Oklahoma as energy revenue is projected to be sufficient to not only meet the minimum debt service target, but also the full equity return threshold through 2033. The forecast equity return ranges between $15.11/MWh in 2023 and $18.98/MWh in 2033. Energy revenue is expected to be at or above the $20/MWh mark over the next decade. Additional revenue from voluntary renewable energy credit sales only adds to the profitability of wind in South Dakota. There is no Electronic Quarterly Report data for recently commissioned South Dakota wind farms.

Regulatory Research Associates is a group within S&P Global Commodity Insights.
This article was published by S&P Global Market Intelligence and not by S&P Global Ratings, which is a separately managed division of S&P Global.
Products & Offerings