Featured Topics
Featured Products
Events
S&P Global Offerings
Featured Topics
Featured Products
Events
S&P Global Offerings
Featured Topics
Featured Products
Events
S&P Global Offerings
Featured Topics
Featured Products
Events
Financial and Market intelligence
Fundamental & Alternative Datasets
Government & Defense
Banking & Capital Markets
Economy & Finance
Energy Transition & Sustainability
Technology & Innovation
Podcasts & Newsletters
Financial and Market intelligence
Fundamental & Alternative Datasets
Government & Defense
Banking & Capital Markets
Economy & Finance
Energy Transition & Sustainability
Technology & Innovation
Podcasts & Newsletters
ECONOMICS COMMENTARY — Nov 17, 2022

By David Owen
New S&P Global PMI™ Comment Trackers provide unique insights into the key macroeconomic trends shaping the global economy. The trackers are derived from qualitative evidence provided by PMI survey panellists around the world, comprising in excess of 30,000 business executives and decision makers in over 40 countries. The trackers help to better understand the causes of changing business conditions, including the impact of changing supply chain conditions, price and demand drivers and recession risks. Inflation trackers, analysed in more detail here, are invaluable tools for understanding why global inflation is running at multi-decade highs in key economic regions.
Alongside the standard response data to S&P Global's monthly Purchasing Managers' Index™ (PMI) business surveys, companies are invited to provide additional qualitative information on the reasons as to why these variables (such as output, new orders and employment) have changed from the previous month. A panel comments tool tracks the frequency of words or phrases mentioned in these qualitative replies.
Every index is calculated as a multiple of its long run average (from 2005), which is set equal to a value of 1.0. A reading of 5.0, for example, therefore suggests that the issue being tracked is being mentioned by survey participants five times the average amount.
The Global PMI Comment Trackers are organised into five themes to demonstrate the state of the global business cycle. These themes are: 1) Capacity Expansion, 2) Demand Shortfall, 3) Inflation, 4) Supply Shortages and 5) Inventories. In November, we focus on trackers that give unique insights into the key drivers of inflation around the globe.
With many countries facing their highest inflation levels since the 1980s, it is important to understand the factors behind rising prices and the severity of their impact. Our Inflation Comment Trackers aim to measure these factors by analysing the responses from our global survey panellists to questions specifically on input prices and output charges. Combining these responses provide valuable information about how underlying costs are affecting inflation over time.
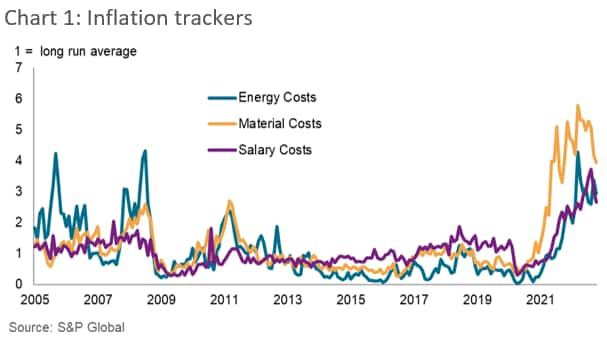
Chart 1 shows three of these comment trackers which look at mentions of energy costs, material costs and salary pressures in the anecdotal reasons. While these trackers are not comparable with each other, they illustrate the relative magnitude of impact on global prices over time, showing if this is growing or diminishing.

While all three trackers have climbed to or close to series peaks in 2022, the Material Costs tracker provided the greatest evidence that inflationary pressures have started to soften. At 3.93 in October, the tracker was down from a record high of 5.78 in March in the immediate aftermath of Russia's invasion of Ukraine, though still signalling that cost pressures from firms' material purchases were around four times the long-run average level.
Similarly, the Energy Costs tracker spiked in March in response to the Russia-Ukraine war, posting 4.27 which was comparable with the height of the oil price shock in July 2008. Since then, the tracker has hovered close to a reading of 3.00, suggesting that firms globally are still reeling from the impact of higher energy prices on their input costs and selling charges.
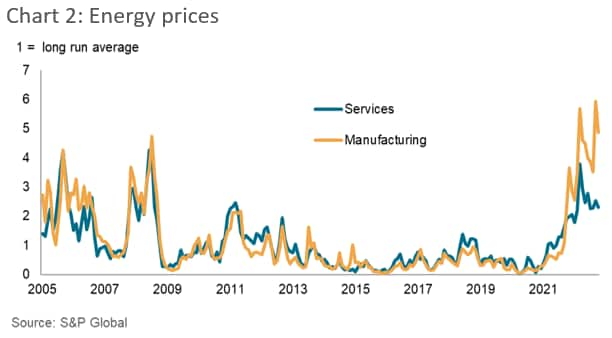
Splitting this tracker by sector in chart 2 shows that manufacturers have unequally felt the burden of higher energy costs in the latest spike of inflation, with this tracker rising to a record high of 5.94 in September. By contrast, energy cost pressures at global services have gradually softened since March, though they also remained well above the long-run trend. With energy price volatility largely tied to the war in Ukraine, it is unclear whether these price pressures have peaked or not.

Sharp rises in inflation combined with tight labour markets meant that firms have also been facing considerable pressure to boost employee wages. This was demonstrated by the Salary Costs tracker in chart 1 which was well above historical trends, reaching a record high of 3.72 in August (prior to August 2021, the tracker's peak was 2.04). Since then, it has slipped to 2.67 in October, suggesting that wage pressures may have eased as businesses globally faced a slowdown in demand. Manufacturers are particularly reporting higher wages more often than usual, with this tracker at 4.35 in October.
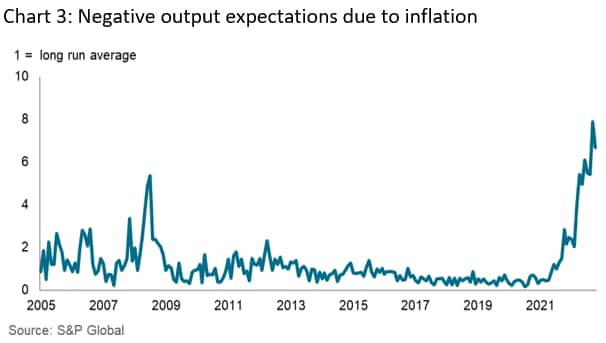
Our PMI Comment Trackers also showed how businesses are adapting their projections for future activity based on inflation levels. Firms expecting output to fall over the next 12 months are increasingly mentioning higher prices as an underlying factor, measured by the tracker in chart 3 which rose sharply to a series record of 9.27 in September. This compared with a reading of 2.49 at the turn of the year and signals that firms expect price pressures to drive a slowdown in demand as clients reassess their spending in the face of rising costs.

Notably, the inflation impact is expected to be much higher than that seen during 2008 and is leading to increased expectations of a global recession - a separate comment tracker shows that "recession" comments are now 4.40 times the usual level and the highest since May 2009. While there are some signs that inflation drivers are beginning to soften, our trackers suggest that price pressures are still well above normal levels, raising the prospect of further monetary policy tightening around the world and subsequent falls in household budgets and business investment.
The PMI Comment Trackers analysed in this note form only a small part of the overall dataset, which includes over 100 additional indices tracking themes such as supply shortages, demand strength, safety stocks and capital investment.
This dataset is available only via subscription. Please contact economics@spglobal.com for further information.
David Owen, Economist, S&P Global Market Intelligence
Tel: +44 2070 646 237
david.owen@spglobal.com
© 2022, IHS Markit Inc. All rights reserved. Reproduction in whole or in part without permission is prohibited.
Purchasing Managers' Index™ (PMI™) data are compiled by IHS Markit for more than 40 economies worldwide. The monthly data are derived from surveys of senior executives at private sector companies, and are available only via subscription. The PMI dataset features a headline number, which indicates the overall health of an economy, and sub-indices, which provide insights into other key economic drivers such as GDP, inflation, exports, capacity utilization, employment and inventories. The PMI data are used by financial and corporate professionals to better understand where economies and markets are headed, and to uncover opportunities.
This article was published by S&P Global Market Intelligence and not by S&P Global Ratings, which is a separately managed division of S&P Global.
Location