Featured Topics
Featured Products
Events
S&P Global Offerings
Featured Topics
Featured Products
Events
S&P Global Offerings
Featured Topics
Featured Products
Events
S&P Global Offerings
Featured Topics
Featured Products
Events
Financial and Market intelligence
Fundamental & Alternative Datasets
Government & Defense
Banking & Capital Markets
Economy & Finance
Energy Transition & Sustainability
Technology & Innovation
Podcasts & Newsletters
Financial and Market intelligence
Fundamental & Alternative Datasets
Government & Defense
Banking & Capital Markets
Economy & Finance
Energy Transition & Sustainability
Technology & Innovation
Podcasts & Newsletters
Research — 28 Jun, 2023

By Sean DeCoff
S&P Global Market Intelligence's Pipeline Activity Index (PAI) posted an increase in May, rising 6.4% to 111 from 105 in April. Like April, the base/other metals PAI again drove the monthly increase, jumping from 86 to 94, while the gold PAI was flat, coming in at 134.
Of the metrics used in our PAI, positive milestones, initial resource announcements and completed financings increased month over month while the number of significant drill results decreased.
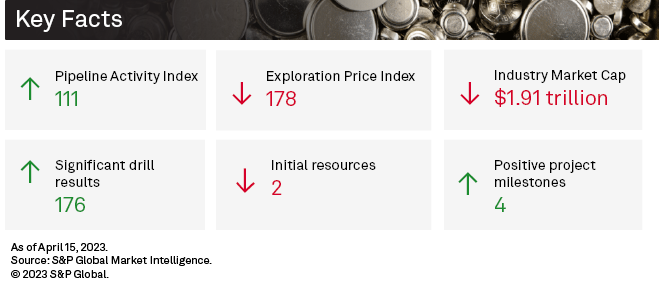
The PAI measures the level and direction of overall activity in the commodity supply pipeline by incorporating significant drill results, initial resource announcements, significant financings and positive project development milestones into a single comparable index.
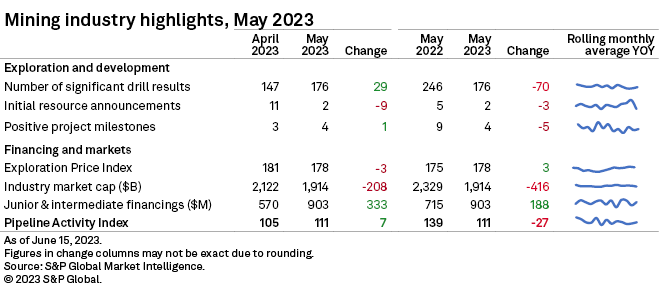
Detailed data on the April PAI metrics is available in the accompanying Excel spreadsheet.
Financings jump 58% after 2-month decline
Funds raised by junior and intermediate mining companies bounced 58% month over month in May to $900 million after two consecutive months of decline. The number of transactions jumped to 295, up 46% month over month and the highest in five months. Significant financings, valued at $2 million or more, jumped to 99 from 65, accounting for 87% of the funds raised, while two transactions valued at more than $50 million took place, compared with none in April.
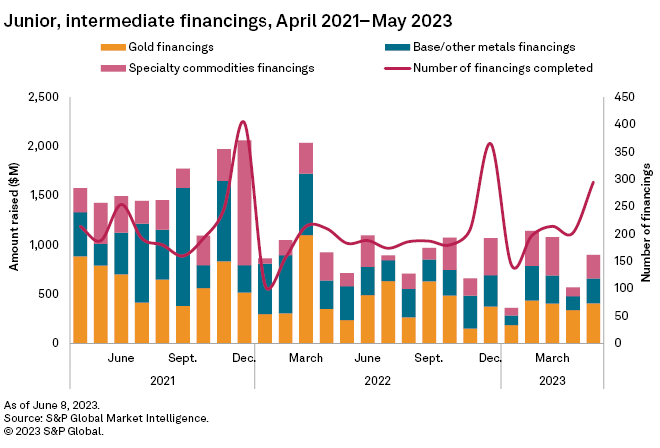
Gold financings increased 20% to $407 million after falling to a three-month low in April. The number of gold financings jumped to 155, up 40% to its highest in five months. The number of significant financings increased to 51 from 37.
The largest gold financing and the second-largest financing overall was an C$83 million private placement follow-on offering, including overallotment by Toronto Stock Exchange-listed Skeena Resources Ltd. Proceeds of the offering will be used to complete exploration and engineering works at the Eskay Creek gold-silver project in British Columbia. Skeena recently completed feasibility studies at this project and is planning to complete an updated resource estimate in June.
Funds raised for the base/other metals group jumped 79% to $254 million, buoyed by increased copper and nickel financings, along with the number of financings rising to a five-month high at 96. The number of significant financings jumped to 29, the highest in 13 months.
The largest base/other metals financing and the third-largest financing overall was a A$70 million private placement by Australian Securities Exchange-listed Chalice Mining Ltd. Proceeds of the capital raising will be used for the ongoing exploration and predevelopment activities of Chalice's Julimar nickel-copper project in Western Australia.
Increased gold activity boosts drilling metrics
Drilling metrics continued to recover in May, recording another month-over-month increase with 332 total projects drilled. The total number of distinct drillholes reported increased 26% to 4,637, but this was still 13% lower year over year. Gold led with an increase to 162 projects, from 123 projects in the previous month, while base/other metals and specialty commodities also posted increases, albeit lower at 4% and 8%, respectively. The number of projects drilled across all stages of development increased, with late-stage up 19% to 152, while early-stage and minesite were both up 15%, to 133 and 47, respectively.
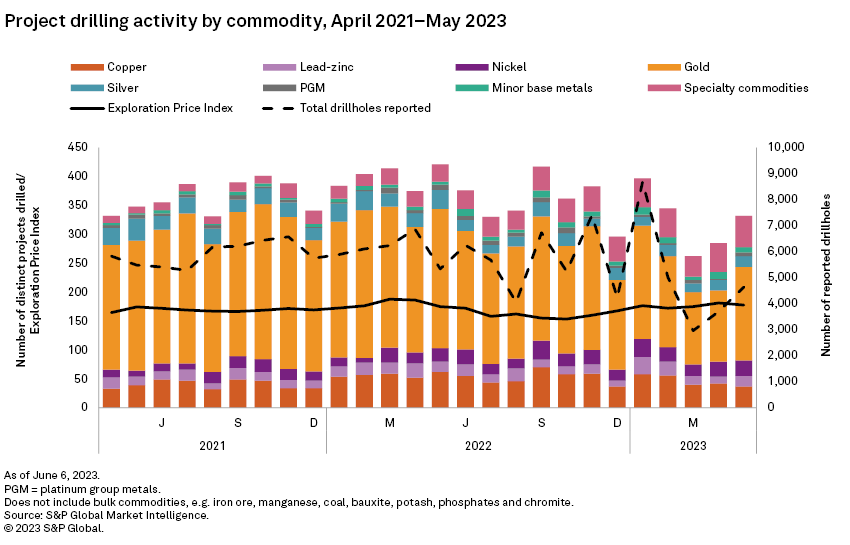
Drilling at gold projects recovered after a 35-month low, with a 32% increase to 162 projects. Specialty commodities projects were up 8% to 54, led by the all-time high of 40 projects drilling for lithium, compensating for decreases in uranium, vanadium, graphite and tantalum. Base/other metals were up by a marginal 4% to 116 projects. An increase in zinc-lead and platinum group metals projects outweighed the decline in copper, cobalt, molybdenum and tin projects.
Australia held its top ranking, posting a year high of 110 total projects drilled along with the largest month-over-month increase of 23 projects. Canada remained second with 90 projects drilled, bouncing back after a decline in the previous month. In contrast to April, the US recorded a decrease for all commodities except lithium, which increased to four projects compared with one in April. Australia accounted for 33% of the monthly total, with gold projects almost doubling, while there were decreases for copper, cobalt, silver and specialty commodities. Canada recorded the second-largest growth month over month, led by an increase in gold projects and the year high for lithium projects.
May's top result came from ASX-listed Great Boulder Resources Ltd.'s advanced-stage Side Well gold project in Western Australia with an intersection of 36 meters grading 91.15 grams of gold per metric ton, 12.9 g/t silver and 0.19% copper. In May, the company announced the completion of a 35-hole, 6,134-meter phase two reverse circulation drill program and began a six-hole diamond drilling program at the Ironbark and Mulga Bill deposits.
ASX-listed major producer Northern Star Resources Ltd. reported the most drillholes in May, with 353 completed among its six gold mines — five in Western Australia and one in Alaska. The company has maintained its A$125 million exploration budget for fiscal year 2022–23.
Initial resource announcements disappoint
Initial resource announcements slipped in May, with only two registered — the lowest monthly total in seven months. Additionally, both announcements were minor.
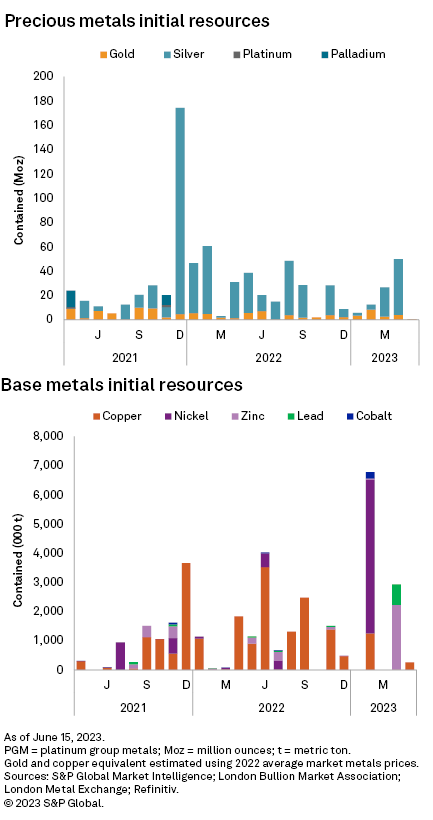
C3 Metals Inc. reported its maiden mineral resource estimate for copper project Jasperoide in Cusco, Peru. The estimates total 56 million metric tons, grading 0.48% Cu and 0.19 g/t Au. The project is estimated to contain 270,000 metric tons of copper and 341,400 ounces of gold.
Coast Copper Corp. reported mineral resource for its gold-copper Merry Widow open pit, located at its optioned Empire property in British Columbia. The estimates report a total 594,000 tonnes grading 3.5 g/t Au and 0.51% Cu. The project is estimated to contain 67,000 ounces of gold and 3,421 metric tons of copper.
Project milestones rebound
Positive project milestones increased month over month to four in May. Two were for gold projects and two were for silver. Mostly notably, two mines entered official production. There were no negative announcements.
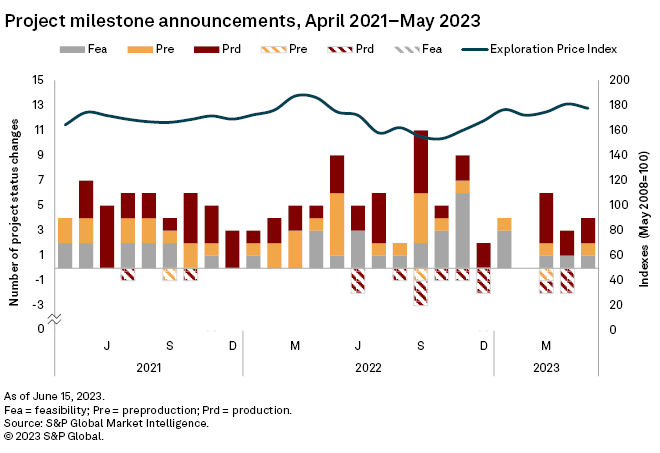
The most notable positive milestone came from Fortuna Silver Mines Inc., which said the first gold pour at its Séguéla Mine gold mine in Côte d'Ivoire took place May 24 as the mine transitions from commissioning to the ramp-up phase. Séguéla is expected to produce between 60,000 and 75,000 ounces of gold in 2023 with annual production well over 100,000 ounces in subsequent years.
Peruvian precious metals miner Compañía de Minas Buenaventura SAA had the second most notable production milestone in May with COO Juan Carlos Ortiz Zevallos saying the company will reopen its shuttered Uchucchacua silver mine after 18 months of exploration work. Uchucchacua, which closed in September 2021 due to low ore grades and high operating costs, will also tap ore from the nearby $80 million to $110 million Yumpag silver project, Ortiz Zevallos said on a first-quarter conference call. Yumpag is expected to start operations in October once final permits have been obtained, according to the COO.
Exploration price index rises
Market Intelligence's Exploration Price Index (EPI) dropped from 181 in April to 178 in May. Of the eight metals included in the index, only platinum and molybdenum posted month-over-month gains. Gold, silver, copper, nickel, zinc and cobalt all weakened. Base metal prices in particular had the largest declines.
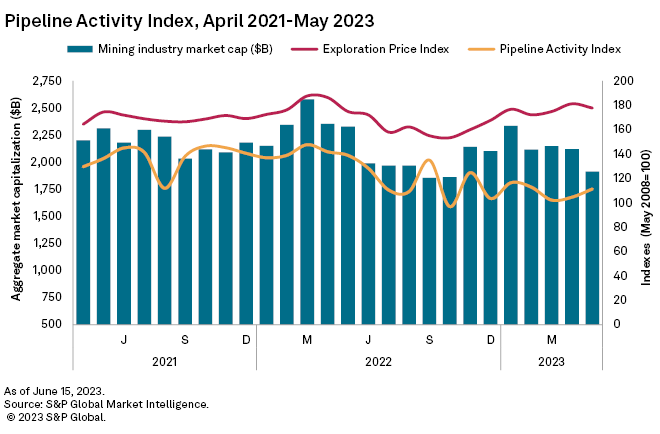
The EPI measures the relative change in precious and base metals prices, weighted by the percentage of overall exploration spending for each metal as a proxy of its relative importance to the industry at a given time.
Equities weaken
Mining equities registered a significant decrease in May as most major metals posted monthly price declines. Market Intelligence's aggregate market cap of 2,540 listed mining companies declined 10% to $1.91 trillion, from $2.12 trillion in April.
S&P Global Commodity Insights produces content for distribution on S&P Capital IQ Pro.
This article was published by S&P Global Market Intelligence and not by S&P Global Ratings, which is a separately managed division of S&P Global.