Featured Topics
Featured Products
Events
S&P Global Offerings
Featured Topics
Featured Products
Events
S&P Global Offerings
Featured Topics
Featured Products
Events
S&P Global Offerings
Featured Topics
Featured Products
Events
Financial and Market intelligence
Fundamental & Alternative Datasets
Government & Defense
Banking & Capital Markets
Economy & Finance
Energy Transition & Sustainability
Technology & Innovation
Podcasts & Newsletters
Financial and Market intelligence
Fundamental & Alternative Datasets
Government & Defense
Banking & Capital Markets
Economy & Finance
Energy Transition & Sustainability
Technology & Innovation
Podcasts & Newsletters
ECONOMICS COMMENTARY — Apr 08, 2021
Global PMI signals fastest rise in firms' input costs since 2008
Charges for goods and services both rise at steepest rates in PMI survey history
US sees sharpest price hikes, led by rising prices for consumer goods
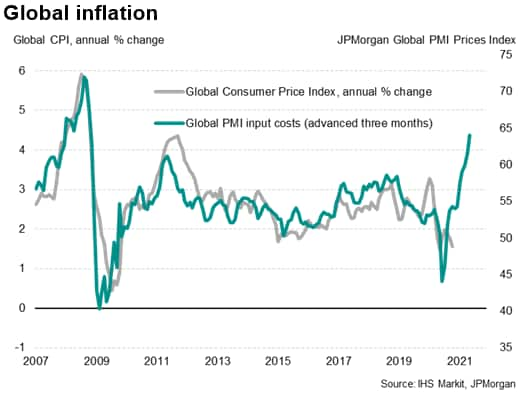
Inflationary pressures have risen worldwide to the highest for at least a decade as a surge in demand is accompanied by widespread supply constraints in the provision of goods and services. The survey data point to a steep rise in consumer price inflation across the world in coming months, most notably in the US, where prices charged for consumer goods rose especially sharply.
Steepest cost pressures since 2008
The input prices index from the JPMorgan Global Composite PMI, compiled by IHS Markit from its proprietary business surveys, rose to its highest since August 2008 in March, indicating by far the steepest rate of input cost inflation seen since the global financial crisis. Costs have now risen globally over the past ten months, having fallen sharply in April and May 2020 as demand collapsed amid the initial lockdowns due to the coronavirus disease 2019 (COVID-19) pandemic, with the rate of inflation rising markedly since the turn of the year.
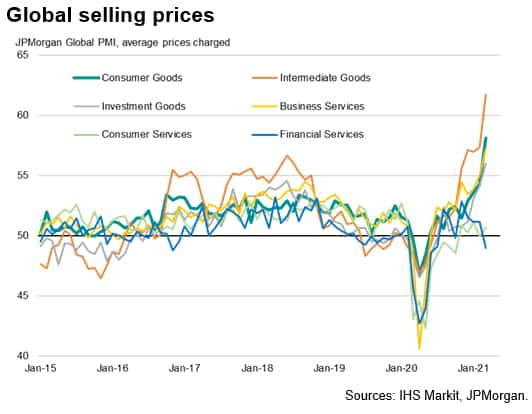
The increase in costs has fed through to the steepest increase in average selling prices for goods and services for over a decade, the recent rate of increase greatly exceeding anything seen since comparable data were first available in late-2009.
Record price hikes for services and goods
Upward price pressures showed signs of spreading from manufacturing through to services, and also to consumers. Manufacturers' material prices rose at a pace not exceeded since April 2011, the rate of increase accelerating markedly on February, while service sector costs (which includes wages, rents and other costs as well as materials and fuel) registered the largest gain since September 2008.
Both manufacturing selling prices and average rates levied for services meanwhile rose at survey record rates, data for which were first produced in 2009.
Near-record supply shortages
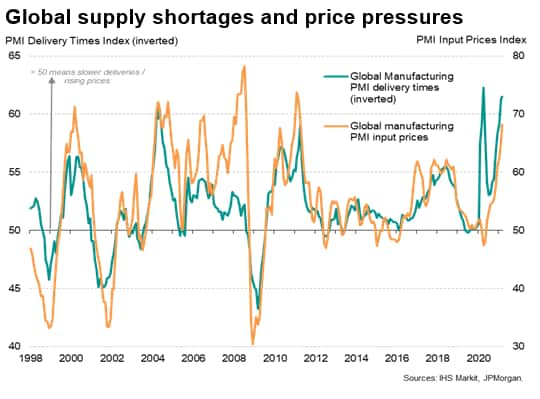
Factories again reported that higher costs reflected rising commodity prices as demand revived and economies recover from lockdowns, often exacerbated by supply shortages. Supplier lead times lengthened at a near-record rate in March, due to both a lack of production capacity and logistics delays. The latter resulted in higher shipping costs for many goods.
It was not surprising to therefore see that the highest price pressures were recorded for intermediate goods - products sold as inputs to other companies, such as electrical and electronics components - as companies not only sought to ensure adequate supply for current production, but also often sought to build additional stocks to safeguard against future supply issues. Average selling prices for intermediate goods consequently rose at the fastest rate yet recorded since data were first available in October 2009.
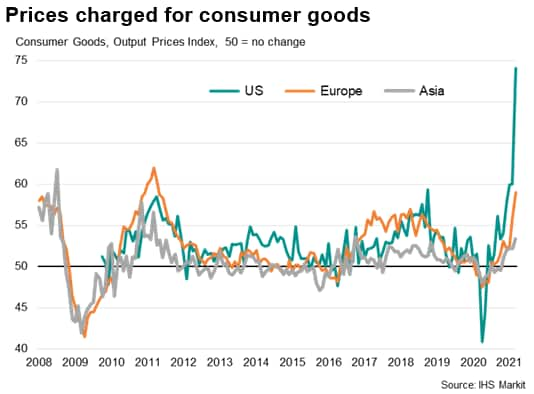
A survey high was also recorded for prices charged for investment goods, such as machinery and equipment, while consumer goods prices increased at the steepest rate for a decade, mainly reflecting the pass-through of these higher intermediate goods prices to final products, as well as greater shipping costs.
However, in one of the strongest indications that the upturn in price pressures is filtering beyond manufacturing, a survey high was also recorded for rates charged for business-to-business services.
Offsetting some of the upward pressure on overall prices was a fall in charges for financial services - the first such decline since last October - and only a muted rise in the cost of consumer services, which remain hard-hit by the pandemic.
Margins squeezed amid record cost increases
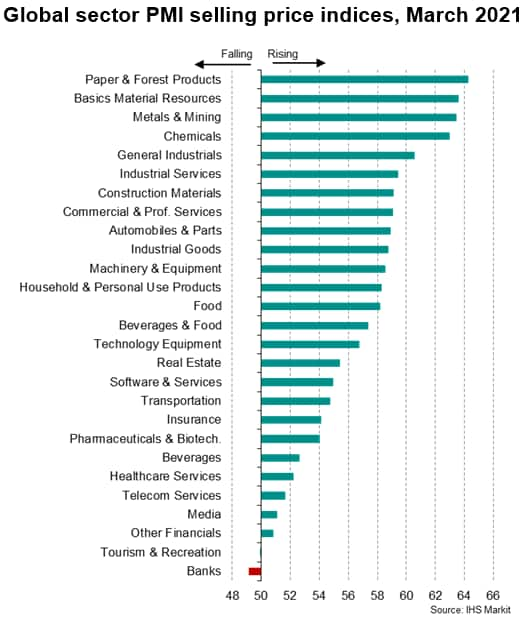
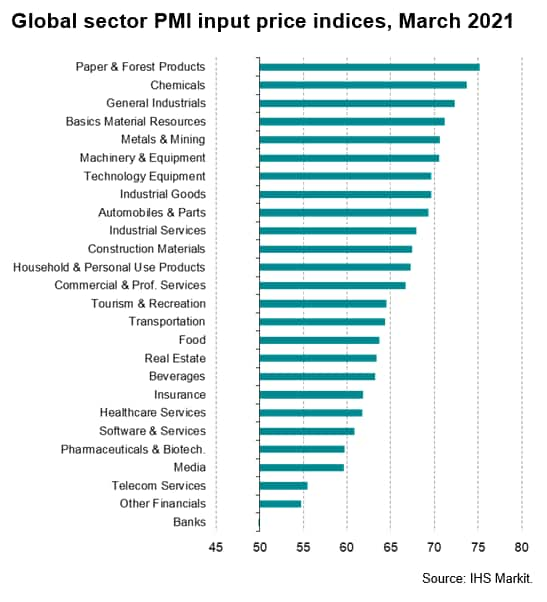
Looking into the sector data in more detail, only banking and transportation charges fell during March, with the latter down only very marginally. However, while the banking sector also reported lower costs during the month, meaning its margin squeeze was the lowest of all sectors covered by the PMIs, the latter saw a survey record rise in costs, pointing to heavily squeezed margins.
Record cost increases were also seen in tourism & recreation, tech equipment, other machinery & equipment, general industrials and paper & forest products, all of which also saw their PMI margin indicators squeezed to especially marked extents.
US reports sharpest price pressures
Price trends also varied markedly among the world's major economies, especially in terms of consumer goods.
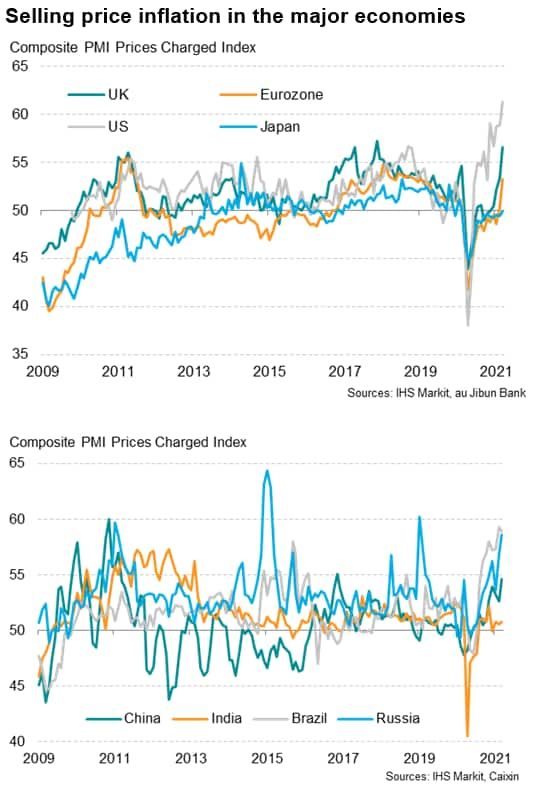
The steepest increase in average prices charged for goods and services was seen in the US, where the latest rise was the steepest recorded since survey data for the US were first available in 2009. Especially steep increases were also seen in the UK, which saw the largest monthly rise since November 2017, as well as in Brazil and Russia, where increases were among the highest recorded by the surveys.
Selling price inflation meanwhile hit the highest since the start of 2019 in the eurozone and the highest since November 2016 in China.
In contrast, only a muted rise in average goods and services prices was seen in India, and Japan reported a marginal decline, albeit registering the weakest fall since the pandemic began.
One of the most important drivers of the above-average rise in selling price inflation in the US was an especially steep hike in prices charged for consumer goods. Not only did US consumer goods producers report the largest rise of all major goods and services product sectors ever recorded by IHS Markit's US survey, but the rate of increase far exceeded that reported in Europe and Asia, hinting at an especially marked pass-through to consumer price inflation in the US.
Chris Williamson, Chief Business Economist, IHS Markit
Tel: +44 207 260 2329
chris.williamson@ihsmarkit.com
Book time with Chris or ask him a question.
© 2021, IHS Markit Inc. All rights reserved. Reproduction in whole or in part without permission is prohibited.
Purchasing Managers' Index™ (PMI™) data are compiled by IHS Markit for more than 40 economies worldwide. The monthly data are derived from surveys of senior executives at private sector companies, and are available only via subscription. The PMI dataset features a headline number, which indicates the overall health of an economy, and sub-indices, which provide insights into other key economic drivers such as GDP, inflation, exports, capacity utilization, employment and inventories. The PMI data are used by financial and corporate professionals to better understand where economies and markets are headed, and to uncover opportunities.
This article was published by S&P Global Market Intelligence and not by S&P Global Ratings, which is a separately managed division of S&P Global.
Location

