Featured Topics
Featured Products
Events
S&P Global Offerings
Featured Topics
Featured Products
Events
S&P Global Offerings
Featured Topics
Featured Products
Events
S&P Global Offerings
Featured Topics
Featured Products
Events
Financial and Market intelligence
Fundamental & Alternative Datasets
Government & Defense
Banking & Capital Markets
Economy & Finance
Energy Transition & Sustainability
Technology & Innovation
Podcasts & Newsletters
Financial and Market intelligence
Fundamental & Alternative Datasets
Government & Defense
Banking & Capital Markets
Economy & Finance
Energy Transition & Sustainability
Technology & Innovation
Podcasts & Newsletters
ECONOMICS COMMENTARY — Apr 05, 2023
Worldwide manufacturing input costs rose in March at the slowest rate for 32 months, according to the latest PMI survey data from S&P Global. Lower energy costs and the biggest improvement in global supply chains since 2009 helped bring raw material cost growth down, most prominently in Europe. Although the surveys also found signs of wage growth having applied upward pressure to manufacturing prices, the overall rate of growth of worldwide factory selling prices also slowed, down to a 29-month low.
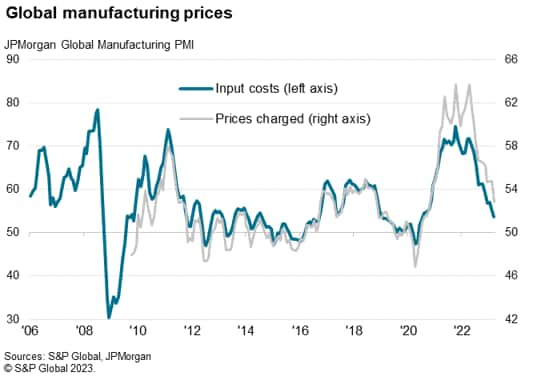
Global manufacturing input costs rose in March at the slowest rate since July 2020, according to the JPMorgan Global Manufacturing PMI, compiled by S&P Global, with the rate of inflation continuing its steep descent from the peaks seen in 2022. The latest input price index reading of 53.7 brings the survey gauge well below its long run average of 56.1.
Average factory selling price inflation likewise cooled in March, down to its lowest for two and a half years, the rate of increase having slowed more or less continually over the course of the past year. The global PMI's output prices index has descended to 52.8 compared to a long-run average of 52.6.
The surveys therefore indicate that input costs are rising at a rate below the long run average while selling price inflation is only marginally above its long run trend, representing stark turnarounds in the inflation picture compared to the near-record rates of increase seen early last year.
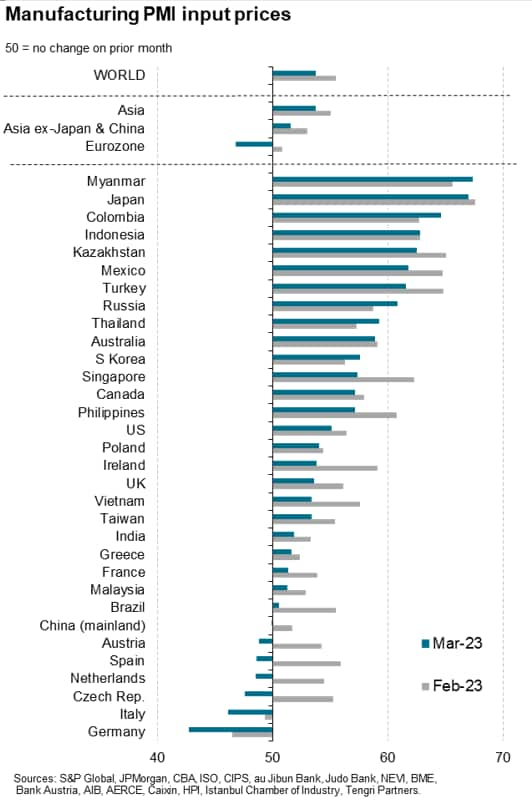
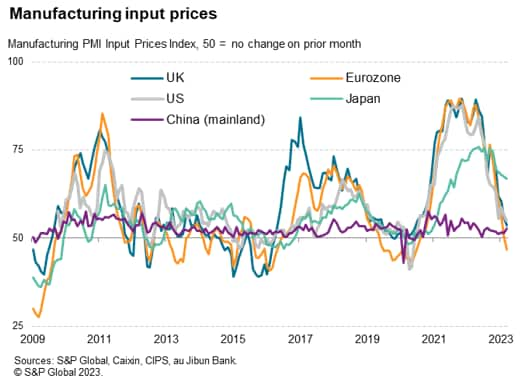
Input costs are now even falling in some countries, notably Germany, Italy, the Czech Republic, the Netherlands, Spain and Austria. Common to all of these countries is their exposure to the energy price spike seen in Europe after the invasion of Ukraine. With European gas prices having fallen sharply in recent months, in part due to a milder than usual winter, factory input costs in the Eurozone are now dropping for the first time since the first COVID-19 lockdowns in early 2020.
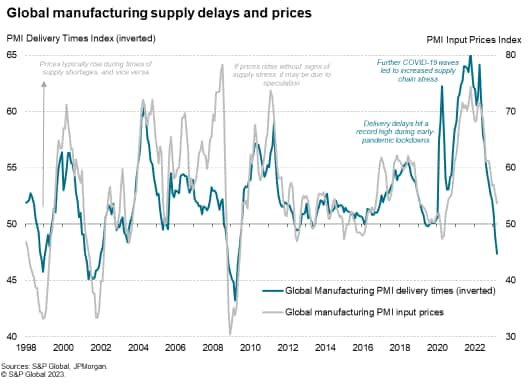
However, the cooling of price pressures is by no means purely an energy story. Supply chain delays, which caused many prices to spike higher during the pandemic as companies were forced to be price takers for many inputs, have eased in recent months. So much so that March saw the greatest improvement in suppliers' delivery times since May 2009.
Supplier lead times have quickened partly in response to supply chain logistical improvements since the height of the pandemic, such as fewer shipping container shortages and less port congestion, but also reflected a cooling of demand for inputs, which has meant suppliers have become less busy and therefore better able to meet demand in a timelier manner. Demand, as measured by new order inflows into manufacturing, fell for a ninth successive month in March, causing input buying to fall for an eighth straight month.
This combination of falling demand and more plentiful supply has naturally helped shift spending power from the seller to the buyer, meaning manufacturers are getting more favorable rates from their suppliers.
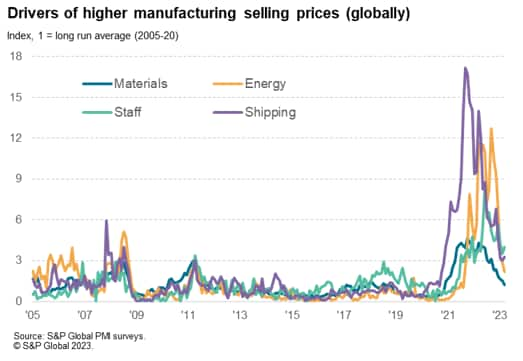
We can look further into what is driving price changes by analyzing the anecdotal evidence provided by PMI survey respondents in the text that accompanies their replies to the main survey questions. These snippets of text can be analyzed for the frequency with which key words are used, resulting in time series data revealing the extent to which varying factors have driven prices higher or lower.
Of four main factors tracked, raw materials are now exerting the lowest pressure on firms' input costs, followed by energy.
The number of times higher raw material prices were cited as a driver of higher input costs globally in March was in fact down to just 1.2 times the long run average. That compares with over four times the long run average this time last year. Similarly, the impact of higher energy prices on firms' cost is now running at just over two times the long run average, down from a peak of nearly 12 times the long run average this time last year.
Two factors, shipping costs and staff costs, are proving more stubborn. Both are running at over three times their long run averages in March, with both having a slightly greater impact on manufacturers' costs than in February. Nevertheless, even these factors are down sharply from prior highs, indicating that the main inflationary thrust from rising staff costs and shipping costs has peaked.
Access the full press release here.
Chris Williamson, Chief Business Economist, S&P Global Market Intelligence
Tel: +44 207 260 2329
© 2023, S&P Global Inc. All rights reserved. Reproduction in whole or in part without permission is prohibited.
Purchasing Managers' Index™ (PMI®) data are compiled by S&P Global for more than 40 economies worldwide. The monthly data are derived from surveys of senior executives at private sector companies, and are available only via subscription. The PMI dataset features a headline number, which indicates the overall health of an economy, and sub-indices, which provide insights into other key economic drivers such as GDP, inflation, exports, capacity utilization, employment and inventories. The PMI data are used by financial and corporate professionals to better understand where economies and markets are headed, and to uncover opportunities.
This article was published by S&P Global Market Intelligence and not by S&P Global Ratings, which is a separately managed division of S&P Global.
Location

