Featured Topics
Featured Products
Events
S&P Global Offerings
Featured Topics
Featured Products
Events
S&P Global Offerings
Featured Topics
Featured Products
Events
S&P Global Offerings
Featured Topics
Featured Products
Events
Financial and Market intelligence
Fundamental & Alternative Datasets
Government & Defense
Banking & Capital Markets
Economy & Finance
Energy Transition & Sustainability
Technology & Innovation
Podcasts & Newsletters
Financial and Market intelligence
Fundamental & Alternative Datasets
Government & Defense
Banking & Capital Markets
Economy & Finance
Energy Transition & Sustainability
Technology & Innovation
Podcasts & Newsletters
Research — 27 Jul, 2023
The combined US and Canadian utility-scale solar generation fleet experienced a 0.5% solar radiation deviation above the norm in the three months ended June 30, 2023, capping its 21.6% year-over-year capacity expansion with a sixth straight quarter of excess sunshine. The sunlight surplus tailed off in the last two months of the period, however, entering the summer a mere 0.2% above the 20-year average.

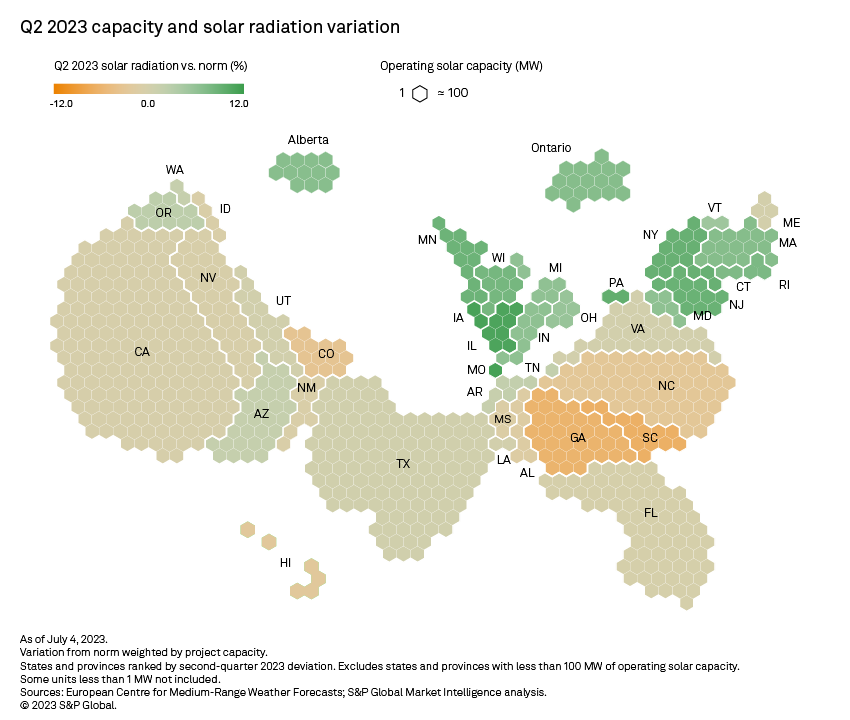
Capitalizing on a generally sunny April, US and Canadian solar projects extended their streak of above-average solar radiation to a sixth consecutive quarter in the three months ended June 30, 2023. Sunlight intensity against the norm was essentially split latitudinally, however, with northernmost US states and Canada in positive territory and the bottom half of the US experiencing subpar sunshine.
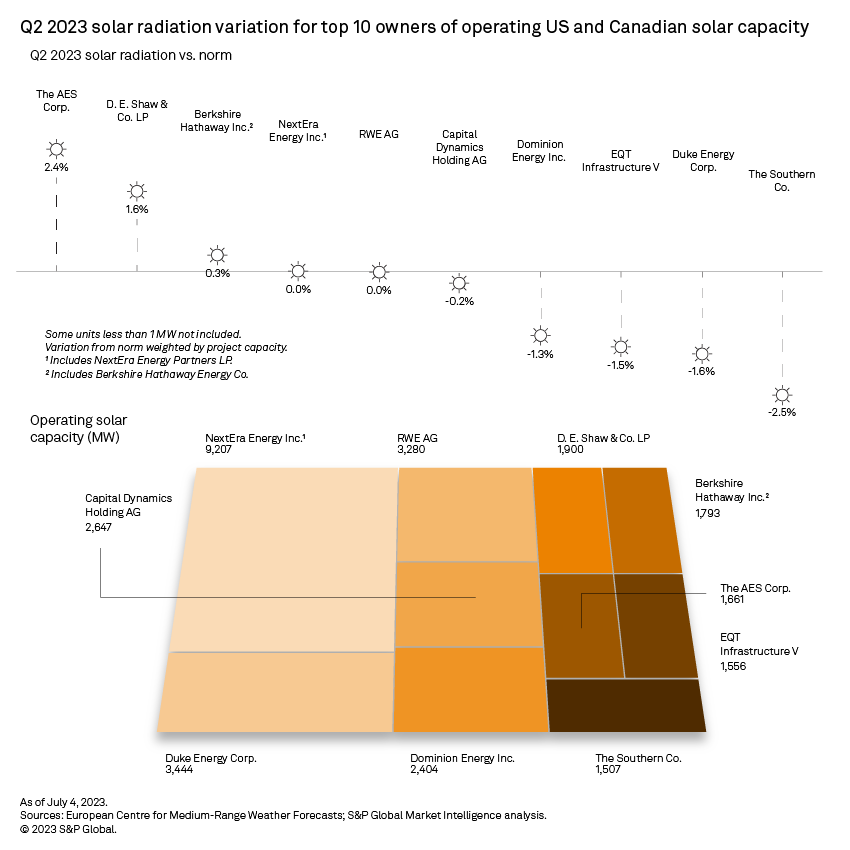
A significant exposure to the lower US latitudes, particularly in the US Southeast, weighed on overall radiation across the portfolios of the top 10 owners of utility-scale solar capacity in the region, with five receiving less sunlight than normal during the period.

All Canadian provinces operating large-scale solar capacity logged above-normal insolation in the second quarter of 2023, up a weighted average 6.6%. Shining on a utility-scale solar fleet that grew 40% annually, the extra sunlight likely contributed to a nonnegligible boost in Canadian photovoltaic power generation. Canada aims to generate 90% of its electricity from renewable and zero-emission resources by 2030. As of writing, the country had 8.5 GW of additional utility-scale solar capacity in the pipeline, of which more than 96% is to be sited in Alberta — Canada's most insolated province, according to 20-year-average radiation data.

In the US, 35 states plus Washington, DC, registered solar radiation above the norm, with the country's northern latitudes logging most of the positive deviations. Across the country's lower, more insolated latitudes, radiation declined. Four of the top five US states by large-scale solar capacity — accounting for 61% of the operating US total — logged subpar sunshine during the period. Texas was the exception, eking out a 0.3% positive deviation. Texas has more than 13 GW of utility-scale solar capacity and an additional 85.6 GW in planning.
In California, which leads the US in deployed solar capacity, operating 23% of the nationwide total sunshine came in 0.5% below normal, despite a sunny April. Overall radiation in the state swung 5.4% above its 20-year average in April, before slipping into negative territory in May and June. Data published by the California ISO July 6 shows a 0.5% year-over-year downtick in solar energy production in the first two months of the second quarter, to 88.6 TW. For perspective, California's utility-scale solar generation fleet grew 13% in the 12 months ended June 30, 2023.
Most of the US Southeast ended the quarter in the red, with South Carolina logging the largest retreat overall, down 6.6%. Georgia is not too far behind, with a 6.1% decline. Most southeastern US states have comparatively small utility-scale solar footprints, making overall generation fleets less sensitive to the ups and downs of insolation levels. In the long run, however, solar capacity in the region will have to expand markedly — following in the footsteps of regional trailblazers Florida and North Carolina — if the US is to meet its long-term decarbonization goals.
Florida, home of the third-largest installed base of utility-scale solar capacity in the US, experienced average solar radiation 0.4% below normal. Florida was essentially split in two, however, during the period under consideration, with the Florida panhandle (in the northwest of the state) in retreat while the rest of the state received extra sunlight. The Southern Alliance for Clean Energy in its "Solar in the Southeast" report June 14 said it projects Florida to surpass 17 GW of solar capacity by 2026. The state has 4.9 GW of utility-scale solar capacity, according to S&P Global Market Intelligence data.

Radiation trends across the lower US latitudes directly impact the largest owners of US utility-scale photovoltaic capacity — all heavily exposed to those coordinates. For example, cloudier skies in Florida, California and Georgia, where some of NextEra Energy Inc.'s largest solar projects are based, kept overall radiation across the company's solar portfolio in line with historical averages, even though 75% of NextEra's solar plants experienced higher-than-usual radiation levels during the period.
With more than 70% of its solar portfolio across Georgia and California, the Southern Co. brings up the rear among the top 10 solar owners in the second quarter, with a radiation deficit of 2.5%. All the company's Georgia-based solar projects logged negative radiation variations, including the company's second-largest one — 128-MW Robins Air Force Base Solar Project, down 6.6%. Only seven of the company's 45 solar farms tracked by Market Intelligence benefited from extra sunshine during the period.
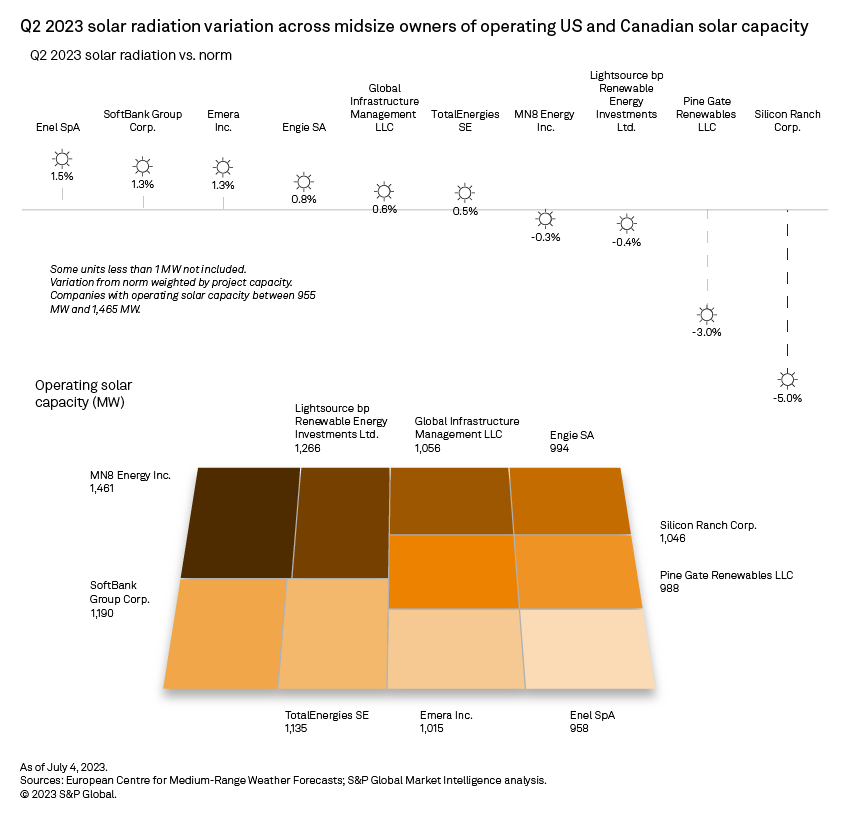
Across the midsize operator segment (companies holding between 955 MW and 1,465 MW of solar capacity), portfolio-wide solar deviations ranged from positive 1.5% to negative 5%. Enel SpA ranks first. With more than 78% of its portfolio in Georgia, Silicon Ranch Corp. is at the bottom of the group. Silicon Ranch's Georgia-based 125-MW SR DeSoto I Solar Project and 107-MW Snipesville II Solar Project — the company's two largest solar projects — had radiation fall 6.6% and 7.2%, respectively, from their 20-year averages in the second quarter. The company's 10 largest solar projects are all located in Georgia.

Solar radiation is the mean surface downward shortwave radiation flux measured from the fifth-generation European Centre for Medium-Range Weather Forecasts reanalysis. This variable includes direct and diffuse solar radiation and is the model equivalent of global horizontal irradiance, the value measured by a pyranometer, a solar radiation measuring instrument. The data is available at quarter-degree latitudes and longitudes, with a spacing of slightly over 27.5 km. This analysis compares second-quarter 2023 radiation values with the 20-year solar radiation average for the corresponding period.
Data visualization by Allen Villanueva.
For wholesale prices and supply and demand projections, see the S&P Global Market Intelligence Power Forecast.
Regulatory Research Associates is a group within S&P Global Commodity Insights.
S&P Global Commodity Insights produces content for distribution on S&P Capital IQ Pro.
Monesa Carpon and Kristin Larson contributed to this article.
This article was published by S&P Global Market Intelligence and not by S&P Global Ratings, which is a separately managed division of S&P Global.