Featured Topics
Featured Products
Events
S&P Global Offerings
Featured Topics
Featured Products
Events
S&P Global Offerings
Featured Topics
Featured Products
Events
S&P Global Offerings
Featured Topics
Featured Products
Events
Financial and Market intelligence
Fundamental & Alternative Datasets
Government & Defense
Banking & Capital Markets
Economy & Finance
Energy Transition & Sustainability
Technology & Innovation
Podcasts & Newsletters
Financial and Market intelligence
Fundamental & Alternative Datasets
Government & Defense
Banking & Capital Markets
Economy & Finance
Energy Transition & Sustainability
Technology & Innovation
Podcasts & Newsletters
ECONOMICS COMMENTARY — Sep 05, 2023
The JPMorgan Global Manufacturing Purchasing Managers' Index™ (PMI™) compiled by S&P Global, remained below 50 in August to signal a continuing downturn of the goods-producing sector worldwide.
Production losses remained modest, with output supported by companies enjoying smoother supply chains and eating into backlogs of work. But new orders continued to fall, led by an intensifying downturn in global trade flows, sending business expectations about the year ahead to their lowest since last November.
Some encouragement can be gleaned from tentative signs of the inventory cycle becoming more supportive to production in coming months, but near-term risks still seem tilted to the downside.
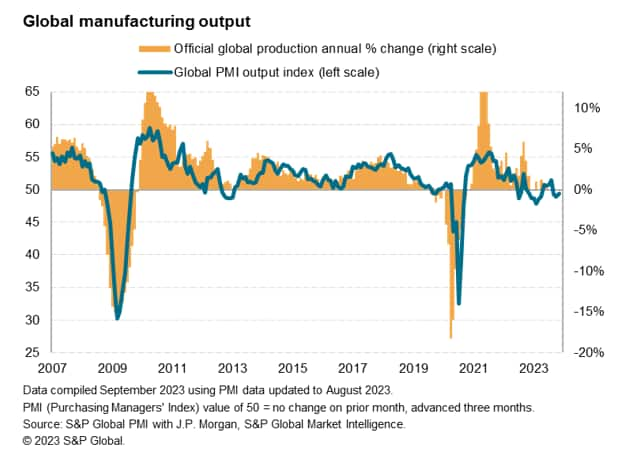
Global manufacturing output fell slightly for a third straight month in August, according to the latest PMI surveys compiled by S&P Global and sponsored by JP Morgan. At 49.4, up from 48.9 in July, the output index from the Global Manufacturing PMI - our preferred measure of current factory production - signaled a slight easing in the rate of contraction but has now indicated falling output in nine of the past 13 months.
The past year has consequently seen the worst spell for global manufacturing since the global financial crisis of 2008-9, albeit the overall decline signaled having been comparatively modest.
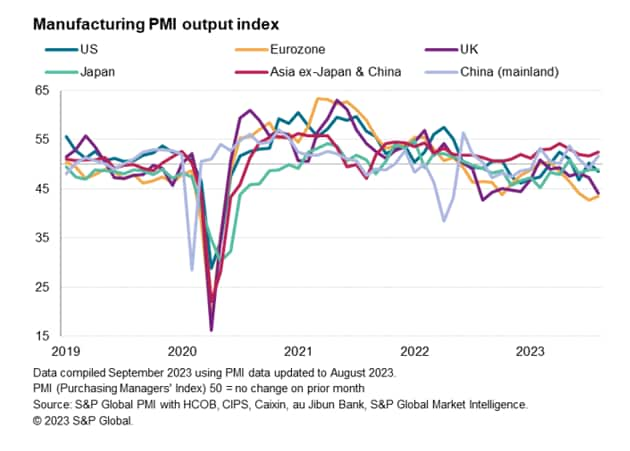
There are some notable regional trends, with Asia generally outperforming. Robust and accelerating growth was seen in Asia excluding China and Japan in August, with India once again the star performer. Mainland China itself also saw a welcome return to growth after output briefly slipped into decline in July for the first time in six months. The overall expansion seen in Asia belied some struggling performances, however, with marked output declines witnessed in Taiwan, Malaysia and South Korea.
Output meanwhile fell in Japan, the US, Canada and in Europe. The eurozone recorded the steepest production decline, led by Germany. However, the UK also reported a worryingly sharp and accelerating downturn.
In both the US and Canada, August saw output fall back into decline after brief respites in July. Mexico likewise saw factory output fall for the first time in three months.
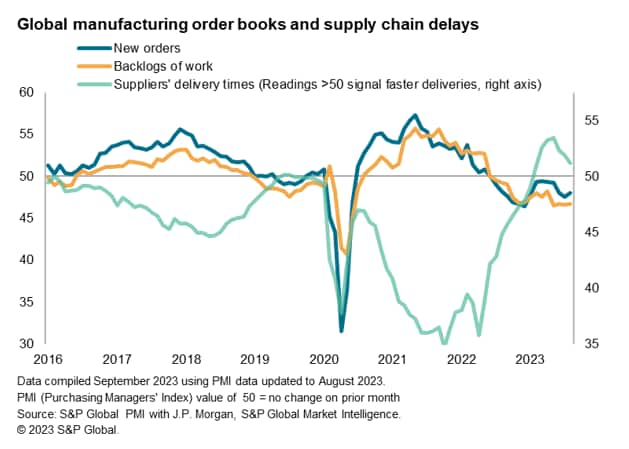
The drop in production could be traced to a fourteenth successive monthly decline in new orders received by factories worldwide. Although the rate of order book decline moderated in August, it remained stronger than the rate at which output was reduced. Hence the relatively steeper rate of loss of orders hints at a further downward production adjustment in September.
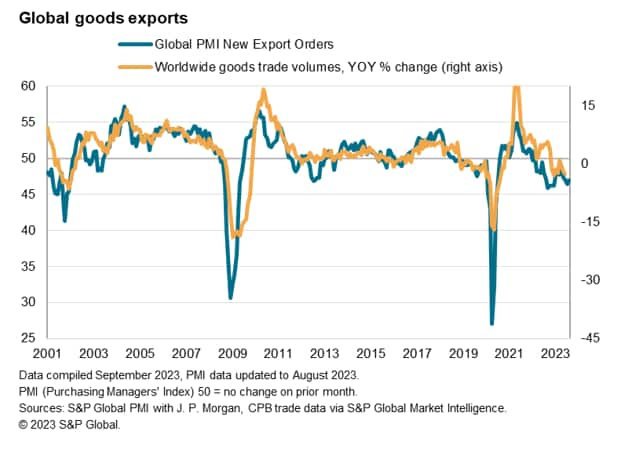
Leading the order book decline was an extension of the recent downturn in global goods trade. New export orders for manufactured goods fell in August for a seventeenth straight month, the rate of decline easing only slightly compared to the sharp deterioration recorded in July. This represents the worst prolonged period of global trade decline since the global financial crisis.
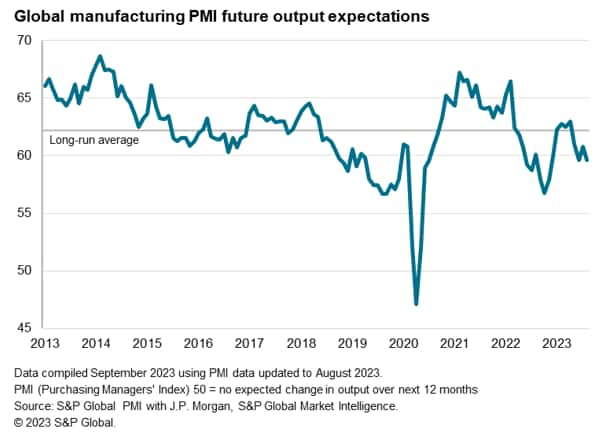
The gap between the rates at which output and new orders were falling in August could once again be explained by companies supporting production through orders placed in prior months. However, these backlogs of orders have now fallen for 14 consecutive months, dropping in August at a rate similar to the steep declines seen throughout much of the past year. The steady erosion of these backlogs of work, in many cases built up during the pandemic, points to the development of excess capacity and contributed to a further pull-back in manufacturers' expectations of output in the year ahead. Production expectations sank in August to the lowest recorded since last November.
Worries about increasing customer reluctance to spend, recession risks, the impact of higher interest rates and the cost-of-living crisis also all dented optimism.
One factor providing a support to production, facilitating the fulfilment of back orders, was a further improvement in supply conditions. Average supplier delivery times shortened globally for a seventh successive month in August. This represents the longest continual period of supply-chain improvement recorded by the survey since the global financial crisis, albeit coming on the heels of the biggest supply chain disruption on record thanks to the pandemic.
However, the improvement in supplier delivery times during August was the smallest recorded for six months, in part reflecting growing delays in the provision of some items.
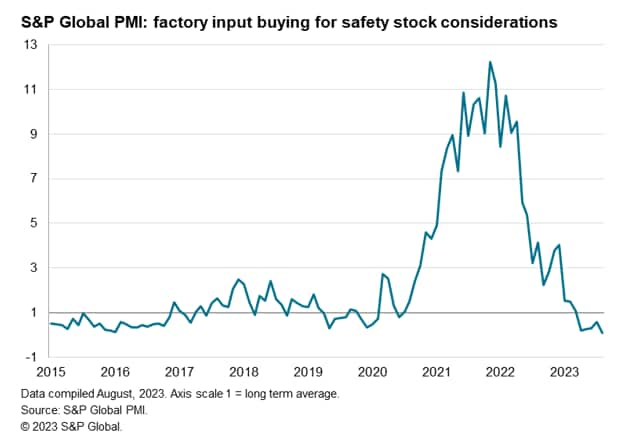
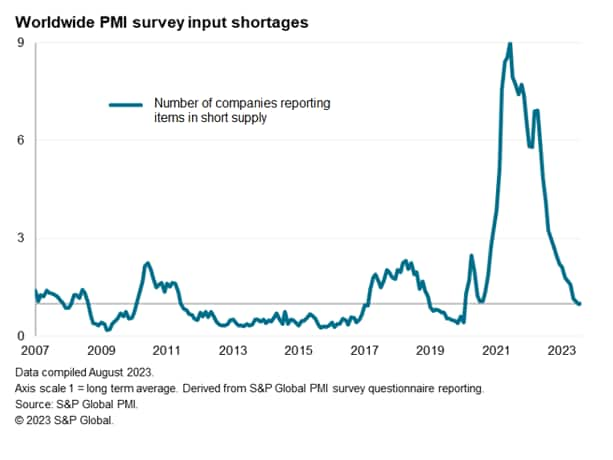
The survey data nevertheless showed that the incidence of input buying for safety stock considerations fell globally in August to the lowest since 2009. The number of companies reporting any items in short supply has likewise continued to fall, down in July and August to its lowest since the start of the pandemic.
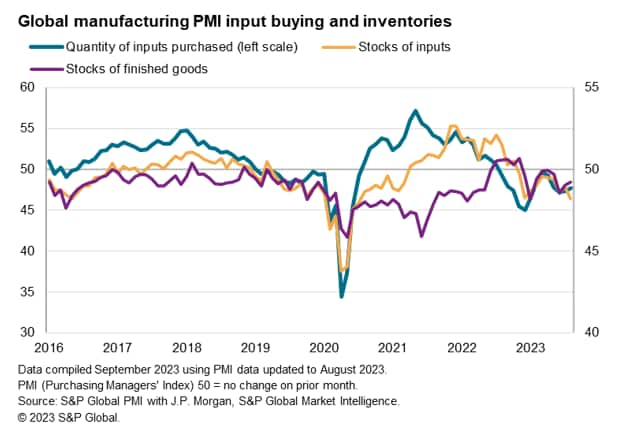
While an unwinding of inventories, accumulated during the supply concerns of the pandemic, has added to the weakness of global manufacturing in recent months, this destocking is showing some signs of peaking.
Although inventories of inputs fell at an increased rate and input buying by manufacturers fell for a thirteenth successive month in August, the rate of decline of the latter eased marginally for a second month in a row.
Stocks of finished goods were meanwhile also cut for the eighth time in the past nine months, but the fall was the smallest for three months.
Looking into the reasons cited by manufacturers around the world for changing inventory trends, we highlight two further series worth monitoring in the coming months.
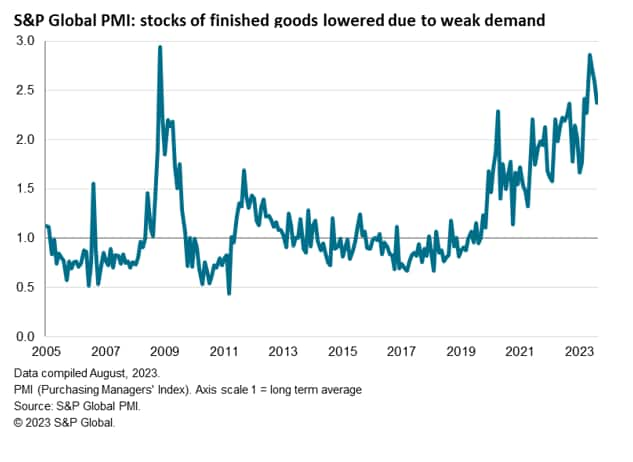
First, we look at the incidence of manufacturers choosing to reduce their inventories of finished goods due to concerns over weak demand. This series peaked back in May at its highest since 2009 and has since fallen, albeit remaining elevated by historical standards.
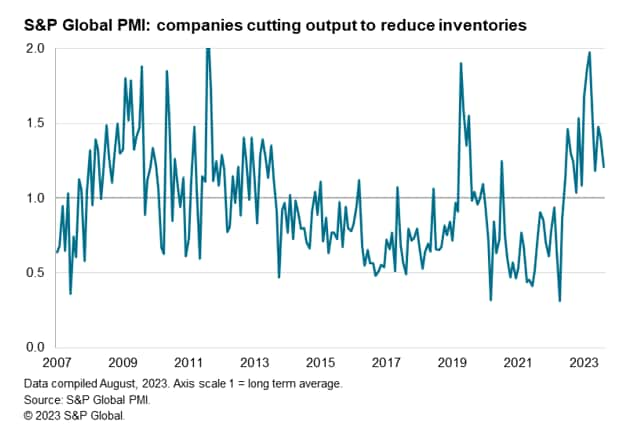
Second, the number of companies choosing to cut output in order to reduce their inventory levels has likewise come down sharply from a peak earlier in the year. This series hit a near-record high in March but is now down to its lowest so far this year. This suggests that the destocking cycle is acting as a reduced drag on global production.
The August surveys point to an ongoing malaise of manufacturing, with production levels continuing to edge lower amid a further deterioration in demand, in turn leading to a depletion of work-in-hand. Global trade in particular is showing further signs of deteriorating, but it is notable that production and order book trends are weakest in Europe and the US amid rising interest rates and elevated inflation.
In this environment, companies are taking a gloomier view on near-term prospects, pulling back on their anticipated output growth in the year ahead as order books deteriorate.
Two factors are identified which are supporting growth: supply conditions continue to improve and there are signs that the destocking cycle may be peaking. These will be two key trends to watch in the months ahead, in the hope that global production will start to revive as we head towards the end of the year. However, given the further worsening of manufacturers' output expectations, the outlook remains one where the balance of risks appears tilted towards further weakness in the coming months.
Chris Williamson, Chief Business Economist, S&P Global Market Intelligence
Tel: +44 207 260 2329
© 2023, S&P Global. All rights reserved. Reproduction in whole or in part without permission is prohibited.
Purchasing Managers' Index™ (PMI®) data are compiled by S&P Global for more than 40 economies worldwide. The monthly data are derived from surveys of senior executives at private sector companies, and are available only via subscription. The PMI dataset features a headline number, which indicates the overall health of an economy, and sub-indices, which provide insights into other key economic drivers such as GDP, inflation, exports, capacity utilization, employment and inventories. The PMI data are used by financial and corporate professionals to better understand where economies and markets are headed, and to uncover opportunities.
This article was published by S&P Global Market Intelligence and not by S&P Global Ratings, which is a separately managed division of S&P Global.
Location
