Featured Topics
Featured Products
Events
S&P Global Offerings
Featured Topics
Featured Products
Events
S&P Global Offerings
Featured Topics
Featured Products
Events
S&P Global Offerings
Featured Topics
Featured Products
Events
Financial and Market intelligence
Fundamental & Alternative Datasets
Government & Defense
Banking & Capital Markets
Economy & Finance
Energy Transition & Sustainability
Technology & Innovation
Podcasts & Newsletters
Financial and Market intelligence
Fundamental & Alternative Datasets
Government & Defense
Banking & Capital Markets
Economy & Finance
Energy Transition & Sustainability
Technology & Innovation
Podcasts & Newsletters
Blog — 15 Dec, 2022

The need for enhanced environment-related disclosure has become more critical than ever to effectively manage emerging risks arising from climate change. While global communities aim to introduce common standards for the ease of reporting and analysis, the ASEAN region is catching up within the space. Earlier this year, ASEAN Exchanges — a collaboration between seven exchanges across Indonesia, Malaysia, the Philippines, Singapore, Thailand, and Vietnam — agreed on a few foundational environmental metrics for disclosure by listed companies.[1] This defined set of voluntary reporting metrics includes commonly known impact indicators, such as Scope 1 and 2 carbon emissions, as well as additional metrics, including total energy consumption, total water consumption, and total waste generated.
According to the ASEAN Exchanges, this initiative aims to address challenges with the consistency and comparability of ESG data by setting expectations for companies to make additional metrics available. While ASEAN companies shall consider how to incorporate these environmental indicators in public fillings, it is meaningful to examine the existing disclosure practices in the region to understand the current adoption level and to identify any potential gaps. Leveraging Trucost Environmental Data offered by S&P Global, the study described in this article aims to reveal major ASEAN companies’ current disclosure practices on environmental metrics.
Disclosure of the Core Metrics – Greenhouse Gas (GHG) Emissions
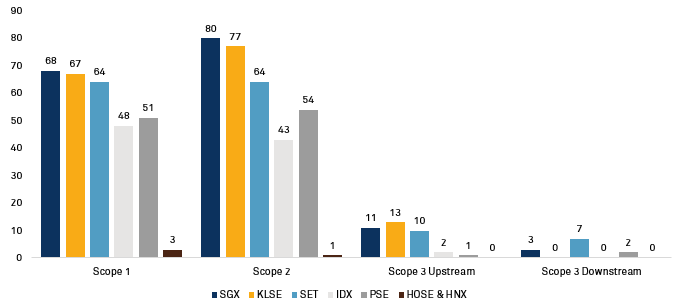
The analysis started with a close examination of the disclosure of GHG emissions, given these metrics form the baseline for assessing corporates’ environmental performance. Through the Capital IQ Pro platform, associated information was filtered and processed for all entities listed in member exchanges under the ASEAN Exchanges,[2] which is summarized in Figure 1 below.
Figure 1: Number of Entities Reporting GHG Emissions Per Exchange

Source: S&P Global Trucost data from S&P Global Sustainable1 and S&P Capital IQ Pro platform data as of October 10, 2022. For illustrative purpose only.
For this study, listed entities are considered reporting entities for either full disclosure or partial disclosure of the respective metrics, where Trucost collects the information from companies’ public fillings or direct submission to third-party databases, such as CDP. Looking at the absolute number, Singapore has the highest number of companies reporting Scope 1 and Scope 2 emissions, followed by Malaysia, Thailand, the Philippines, Indonesia, and Vietnam. It is important to note that the number of entities reporting Scope 2 emissions is generally higher than entities reporting Scope 1, which can potentially be explained by the fact that measurement for Scope 2 emissions typically requires fewer inputs; therefore, more entities are able to calculate and present firm-level information.
The number of entities disclosing Scope 3 emissions, which are not directly produced by a company itself, is significantly lower. On the individual exchange level, less than 20 entities were found reporting upstream emissions and less than 10 entities were found reporting emissions associated with downstream activities. These findings align with the market consensus that Scope 3 emissions are generally more difficult to measure. Substantial supply chain level data and sophisticated calculation methods are typically involved, leading to a challenging process to derive reliable outputs for both Scope 3 upstream and downstream emissions.
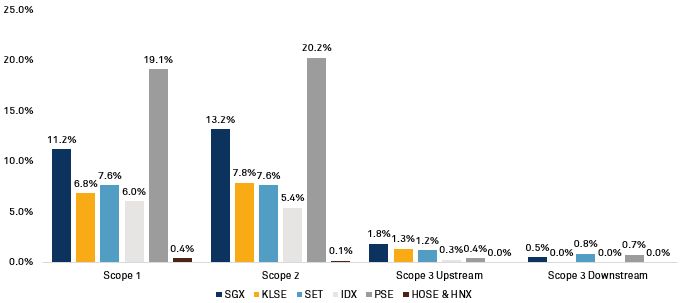
Significant gaps were revealed when converting the absolute numbers to the reporting rate of GHG emissions per exchange. The Philippines stood out from the region, with approximately 20% of entities reporting Scope 1 and Scope 2 emissions. Singapore was second, with a lower double-digit percentage rate, followed by Thailand, Malaysia, and Indonesia with single-digit percentages. Reporting rates for Scope 3 emissions remains low, with less than two percent of the listed entities disclosing the information.
Figure 2: GHG Emissions Reporting Rate Per Exchange

Source: S&P Global Trucost data from S&P Global Sustainable1 and S&P Capital IQ Pro platform data as of October 10, 2022. For illustrative purpose only.
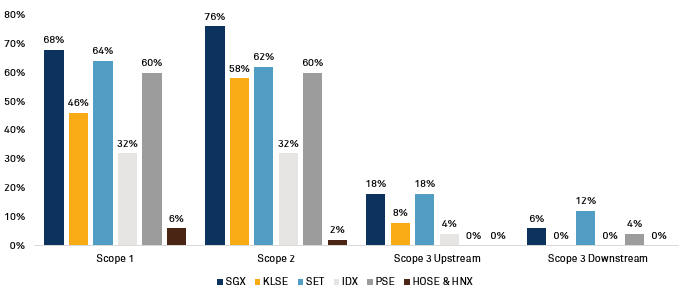
By analyzing the performances of the top 50 listed companies from each exchange based on market capitalization, substantial improvements in reporting rates were observed. As reflected in Figure 3 below, more than 60% of companies listed in Singapore, Malaysia, and the Philippines have been making Scope 1 and 2 emissions publicly available. Reporting rates for Scope 3 upstream emissions is now close to 20% for Singapore and Thailand. Based on the results, large-cap companies are taking the lead with GHG emissions disclosure, which is potentially driven by more firm-level resources and support, as well as increasing investor scrutiny over environmental practices.
Figure 3: GHG Emissions Reporting Rate for Top 50 Listed Entities Per Exchange

Source: S&P Global Trucost data from S&P Global Sustainable1 and S&P Capital IQ Pro platform data as of October 10, 2022. For illustrative purpose only.
Reporting Additional Environmental Metrics – Waste & Water
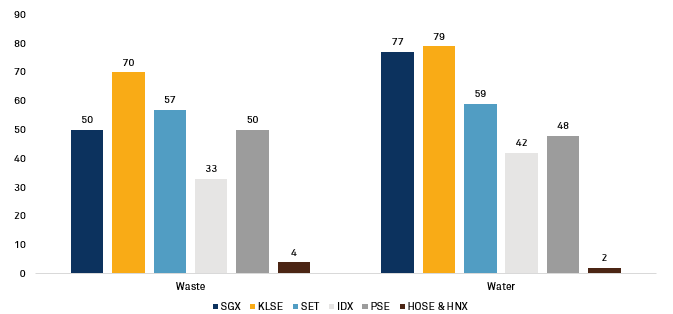
On top of emissions data, Trucost also collects other environmental impact metrics from public sources, including, but not limited to, waste, water, pollutant, nature resources usage, fossil fuel exposure, and power generation activities. Therefore, further analysis was conducted on reporting practices for waste and water-related indicators outlined by the ASEAN Exchanges. While more companies disclosed water consumption metrics than waste information, the absolute numbers of reporting entities generally aligned with the figures for Scope 1 and 2 emissions.
Figure 4: Number of Entities Reporting Waste and Water-Related Metrics Per Exchange

Source: S&P Global Trucost data from S&P Global Sustainable1 and S&P Capital IQ Pro platform data as of October 10, 2022. For illustrative purpose only.
Looking Ahead: Can the Disclosure Gap Be Filled?
Given the limited environmental information available within the ASEAN region, the market may encounter immense challenges in reliably measuring environmental impacts and evaluating potential risks. While regulators and organizations like the ASEAN Exchanges are pushing for enhanced disclosure requirements, it is challenging to project when the disclosure gap can be filled. For market participants with imminent needs, especially financial institutions, the availability of environment-related data remains a critical concern.
To better address the current data gaps in the market, Trucost offer estimations on environmental impact metrics for an expanded company universe by leveraging its proprietary Environmentally Extended Input-Output (EEIO) Model. After incorporating Trucost’s estimations, the updated ASEAN coverage figures for GHG emissions showed substantial improvements: the overall number of entities increased to 934, while any data gap, especially regarding missing data for Scope 3 emissions, was also filled.
Figure 5: Number of ASEAN Entities Covered by Trucost Universe for GHG Emissions

Source: S&P Global Trucost data from S&P Global Sustainable1 and S&P Capital IQ Pro platform data as of October 10, 2022. For illustrative purpose only.
Built upon over two decades of market experience, Trucost Environmental Data aims to present holistic views on companies’ environmental performances and empower enhanced environmental analytics. While Trucost’s database serves as an effective solution to meet current market requirements, the ultimate goal is to seek direct participation from companies to measure and disclose associated environmental impacts.
Certain regulators are moving ahead to incorporate mandatory environmental and climate-related reporting requirements into the listing rules. One notable example is the Singapore Exchange, where disclosure of metrics aligned with the Task Force on Climate-related Financial Disclosures (TCFD) has become mandatory from financial year 2022 onwards.[3] On top of disclosure of fundamental environmental metrics, companies must comply with enhanced TCFD recommendations to conduct holistic climate risk assessments. The ASEAN market should likely anticipate more compliance measures that will encourage robust disclosure practices.
Alongside the regulatory tailwind, investors and financial institutions now demand more environmental information from corporates to better manage climate risk exposure. With these clear signals from the market, corporates need to take active ownership to measure their environmental impacts and to be further prepared to tackle climate change.
Zero In On Your Net Zero.
Turn your net zero commitments into action with essential sustainability data and analytics. We’ll show you the numbers that add up to your net zero – and the steps you need to get there.
Get comprehensive carbon footprints that quantify GHG emissions across the entire global value chain. Learn more.
[1] https://www.businesstimes.com.sg/companies-markets/asean-exchanges-publishes-table-comparing-sustainability-reporting-regimes
[2] Including Bursa Malaysia (KLSE), Hanoi Stock Exchange (HNX), Ho Chi Minh Stock Exchange (HOSE), Indonesia Stock Exchange (IDX), Philippine Stock Exchange (PSE), the Stock Exchange of Thailand (SET), and the Singapore Exchange Group (SGX).
Blog
Research Analysis
Theme