


18 Mar, 2021
From Trough to Froth: US leveraged loan market, a year after the COVID-19 crash

We are approaching one year from the March 23, 2020, pandemic-inspired trough of what would ultimately become a short-lived bear credit cycle. The precipitous U.S. leveraged loan market decline and subsequent rally were both unprecedented in severity. A torrent of Fed liquidity has brought the markets full circle, and traditional markers of late-cycle, risk-on exuberance are seen rising at a time when defaults remain above historical averages and corporate leverage remains near historical highs.
 |
Request a demo of LCD to see more of the top leveraged finance stories
Request DemoSo, one year after the market crash brought about by the COVID-19 pandemic, LCD takes a look at where the U.S. leveraged loan asset class stands today.
Evaporating yields
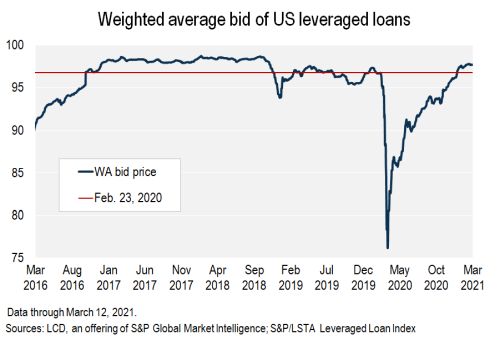
As the COVID-19 crisis escalated, the weighted average bid price of the leveraged loan index plunged from 95.18 on Feb. 29, 2020, to 76.23 on March 23, 2020. Fast forward a year to Feb. 28, and loan prices in the secondary had not only fully rebounded but stood 260 basis points higher than the year-prior mark, at 97.78. This also marked the highest reading since November 2018 and reflected a 159-bps rise from the end of 2020.
 |
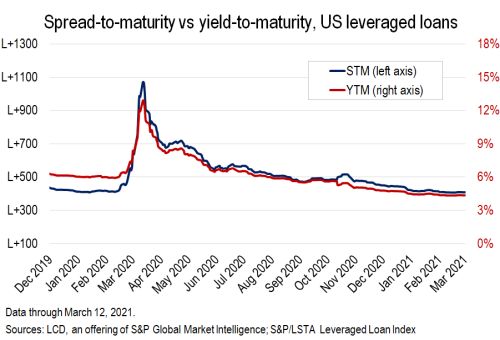
On the flip side of that metric, the yield-to-maturity for loans in the index fell in February to its lowest point since April 2004, at 4.33% — just 8 bps above the all-time low of 4.25% in March 2004. The current level is roughly 40 bps below the end-of-2020 reading and is a long way from the pandemic peak of 12.87% last March.
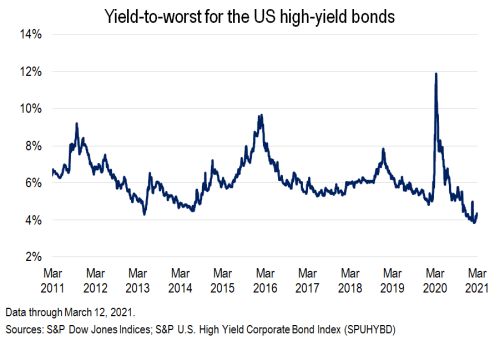
Of course, from a relative value perspective, the liquidity pumped into the system by the Fed and rock-bottom Treasury rates have resulted in low yields across credit markets. In the high-yield asset class, which grabbed market share from leveraged loans last year, yields in the secondary market hit a record low on Feb. 16 of just 3.86%. Per the S&P U.S. High Yield Corporate Bond Index, this is the first time the yield-to-worst has ever dipped below 4%.
 |
 |
Irrational exuberance?
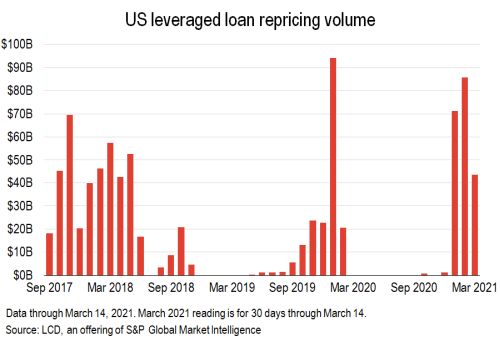
Against this backdrop of evaporating yields, and in the face of the highest monthly supply shortage on record, as measured by LCD, loan investors this year have turned to riskier offerings, those historically seen as markers of top-of-cycle behavior. These include venturing further down the capital structure to second-lien loans, funding loans from lower-rated borrowers (which is taking place at a record pace), and lending to companies to fund the dividends of private equity sponsors. Investors have also had to concede a surge of loan repricings — another hallmark of a frothy credit environment. In lowering the cost of funds for an issuer, the returns realized for the lender/investor decline as well, of course.
According to LCD, the loan market accommodated $140.1 billion in repricings this year through March 14, a 22% increase over last year's pace and nearly matching the $144 billion seen over the entire first three months of 2018.
 |
Despite continued concerns around overall credit deterioration and the ability of companies to service debt in a pandemic-limited economy, 42% of borrowers funding in the U.S. leveraged loan market so far this year held a relatively risky B-minus rating — just one notch higher than the default-vulnerable triple-C band — by at least one agency.
Meanwhile, in another illustration of the frothy conditions, issuance of second-lien loans, which are subordinated in the event of default to first-lien tranches of the issuer's debt, ballooned to $9.6 billion in the year to March 14, according to LCD.
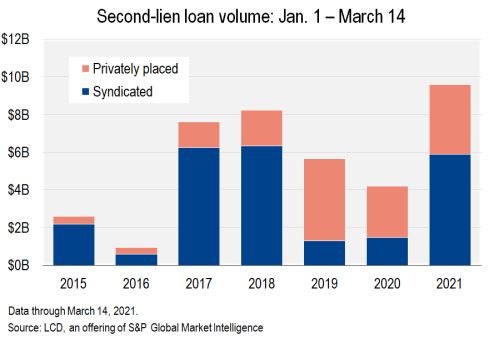 |
Request a demo of LCD to see more of the top leveraged finance stories
Request DemoThis outpaces similar activity in 2018, when earnings, and the broader economy, were much stronger. As with B-minus rated issuance, the borrowing cost on these loans has fallen to the lowest level since before the Great Financial Crisis.
In another indication of risk-on appetite, loans backing dividend recapitalizations have had one of the strongest starts in years. Dividend-related new-issue volume for companies that are owned by private equity firms shot to $14.6 billion in 2021 through March 14.
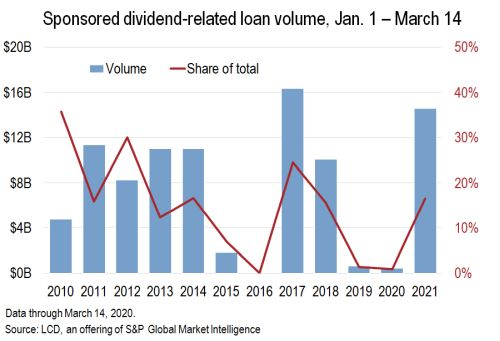 |
That is the second-highest tally for the time frame since LCD began tracking this metric 20 years ago, behind only 2017. It represents 16.5% of the total new-issue leveraged loan deal flow to sponsored borrowers during this period, also the highest mark since 2017.
In spite of the record $61 billion of institutional loan issuance in February, the aforementioned wave of opportunistic deals comes against a backdrop of a severe supply/demand imbalance that heavily favors issuers.
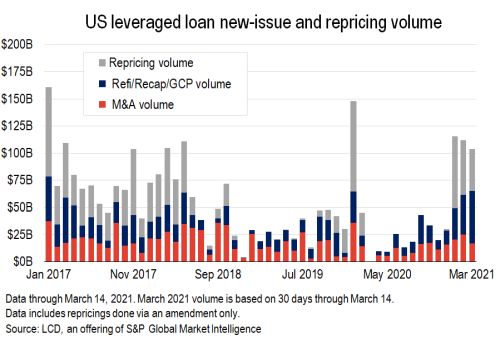 |
The recent positive tailwind of underlying long-term Treasury yields, which finally vaulted from rock-bottom levels, helped encourage some $150 billion of institutional loan issuance so far this year (through March 14), which is just slightly shy of the U.S. record of $151 billion during the same period in 2017 — a year that featured a record $503 billion of institutional loan issuance. Institutional loans are the kind bought by CLOs, and by retail investors via mutual funds and ETFs.
 |
But this activity comes after issuance finished down 7% in 2020, at $289 billion. Moreover, the bulk of this year's activity comes from repricings — which do not count as new-money transactions — along with refinancings and recaps, in which new debt typically replaces existing debt.
By the end of February, the par amount outstanding tracked by the index had contracted by $16.4 billion this year, meaning that all loans issued over this period did not fully cover repayments, leaving no net supply.
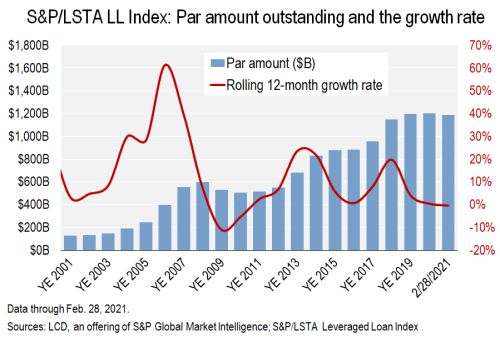 |
This brought the total par amount outstanding of U.S. leveraged loans to $1.188 trillion, the lowest reading since October 2019.
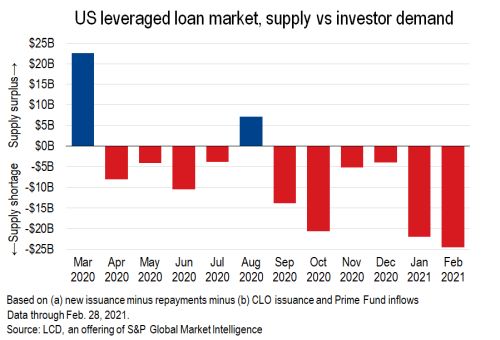
Again, combining this with LCD's measure of demand in the leveraged loan market (collateralized loan obligation issuance plus retail cash flows to U.S. loan funds), the supply shortage in February was a record $24.6 billion.
 |
Dearth of distress
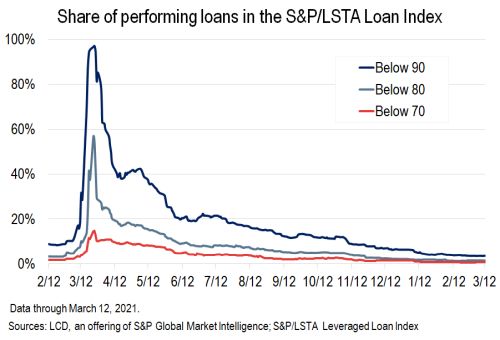
Thanks to the supportive market conditions that have allowed troubled companies to prove they have access to liquidity by funding in the leveraged finance markets and the scores of companies securing breathing room on credit terms, the share of loans priced in technical distress — i.e., below 80% of face value — fell to 1.53% at the end of February. That is the lowest month-end reading since September 2018. The share below 70 is almost nonexistent, with just 0.43% of loans below this level. At the March 23, 2020, peak, 57% of loans were below the 80 mark and 15% below 70.
 |
Defaults elevated
When all is said and done, the leveraged loan market remains in a default cycle, and leverage still sits close to record highs.
The trailing-12-month default rate of the S&P/LSTA Leveraged Loan Index fell to 3.25% by amount in February, from 4.17% in September. The September level was the highest in the current cycle of above-average defaults.
 |
Nevertheless, without a fresh wave of new bankruptcies and payment misses, the loan default rate could fall back to below the 2.9% historical average in a matter of months. April through July was a particularly active period of default activity in 2020, and $30.8 billion of defaults are scheduled to roll off the calculation over those upcoming months.
Hypothetically, calculating from February's amount outstanding in the index (excluding defaults), that would take 267 basis points off the 3.25% default rate, assuming no new defaults.
Credit deterioration
This lack of distress comes despite the loan market exhibiting a significant deterioration in rating quality in the broader Index — a trend exacerbated by the pandemic-inspired downgrade cycle of 2020 and, more recently, a banner pace of loan issuance from the B- ratings cohort.
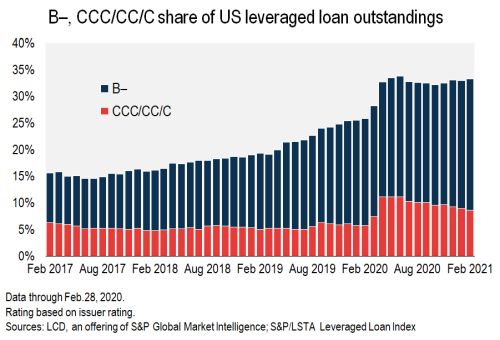
The share of B-minus rated issuers in the S&P/LSTA Leveraged Loan Index stood at a record high of 24.7% as of Feb. 28, and 33.4% of loans are rated B-minus or lower. That's nearly $400 billion of outstanding loans. CCC or lower loans now make up 8.6% of the index, down slightly from 11.2% at the high last year but up compared to just 3.6% in December 2015.
 |
At the more granular level, when looking at the average debt-to-EBITDA leverage for public companies in the S&P/LSTA Index, leverage, at 6.16x in the third quarter of 2020, eased from a record high of 6.41x in the second quarter but was above the six times leverage limit adopted by regulators in 2013 to curb risky lending.
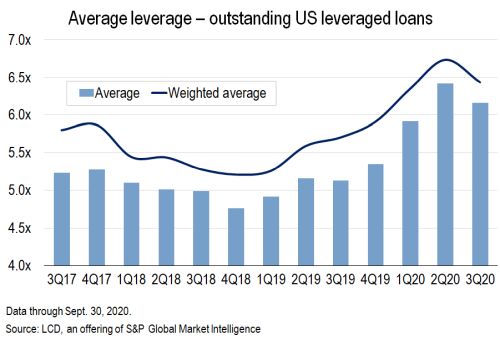 |
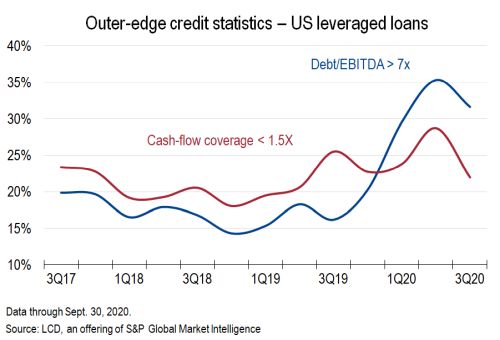
Publicly filing companies in the index on the "outer edge" of credit metrics, which might have less room for error (companies with leverage topping 7x and cash flow coverage of under 1.5x), indicate a possible turn further down the road. Among the public companies in the index, 32% carried more than 7x leverage in the third quarter of 2020, compared to just 16% in the third quarter of 2019.
Nevertheless, while 22% of companies were maintaining a cash flow coverage inside of 1.5x, this is an improvement from 26% the previous year and is significantly better than where this metric stood ahead of the Great Financial Crisis, when 37% of issuers at the end of 2007 were operating with a cash flow coverage below this critical threshold.
 |