Featured Topics
Featured Products
Events
S&P Global Offerings
Featured Topics
Featured Products
Events
S&P Global Offerings
Featured Topics
Featured Products
Events
S&P Global Offerings
Featured Topics
Featured Products
Events
Language
Featured Products
Ratings & Benchmarks
By Topic
Market Insights
About S&P Global
Corporate Responsibility
Culture & Engagement
Featured Products
Ratings & Benchmarks
By Topic
Market Insights
About S&P Global
Corporate Responsibility
Culture & Engagement
S&P Dow Jones Indices — 8 Jan, 2021
This article is reprinted from the Indexology blog of S&P Dow Jones Indices.
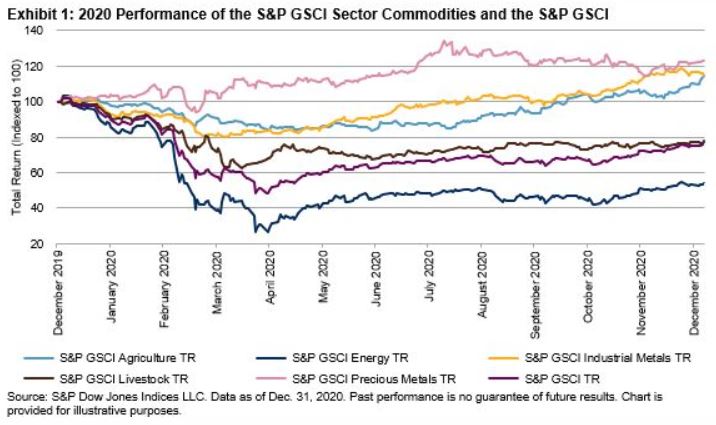
Last year might end up being known as the year of countless inflection points. Narratives that were playing out over months and years were accelerated or reversed with volatility not seen since World War II. Among commodities, there were new all-time highs hit in gold and new all-time lows that reached into negative territory for crude oil. Exhibit 1 shows that while the S&P GSCI dropped 24% for the year, three sectors finished positive and a monstrous 69.24% separated the best-performing S&P GSCI Precious Metals from the worst performing S&P GSCI Energy.

One of the most monumental narratives of 2020 involved the April dip into negative territory for WTI Crude Oil front month futures. Fiona Boal explained what happened during this extreme time in commodities history and how Crude Oil Can Get Carried Away by Contango. Inflows into ETFs tracking crude oil exploded, with many market participants trying to buy the dip. Economies have slowly reopened since, but energy usage is still below 2019 levels. The one bright spot within energy was the S&P GSCI Unleaded Gasoline, which rose 12.82% in December. Holiday travel demand picked up in the Western Hemisphere while demand overall for autos remained strong, as they are seen as one of the safest ways to travel during a pandemic. The S&P GSCI Natural Gas dropped 12.56% in December as warm winter forecasts reduced the need to stock up for building heating needs.
The S&P GSCI Agriculture and S&P GSCI Livestock took two very different paths in 2020. The former rose 14.94% while the latter fell 22.10%. As these have been somewhat correlated historically due to the use of grains as feed for livestock and geographically being grown in some of the same areas, 2020 was an inflection point. Except for coffee, every S&P GSCI Agriculture constituent rose, most by double digits. The most fundamental reason for bullishness was the surprise shortfall in grain stocks, which pushed some grains to multi-year highs. Following years of oversupply, the increasingly unpredictable weather patterns and the return of purchases from large consumer nations such as China represented an inflection point for agricultural commodities in 2020. The 2020 Atlantic hurricane season had the most hurricanes on record, with 30 named storms, over two and a half times more than the average. While many meat producers were hit hard with COVID-19 outbreaks in their plants reducing supply, the hog herd in China returned with gusto after 2019’s African Swine Fever outbreak. The supply in China more than offset any reduction in the U.S. On the demand side, U.S. restaurant dining picked up during Q3 2020, but fell again to June levels by the end of Q4.
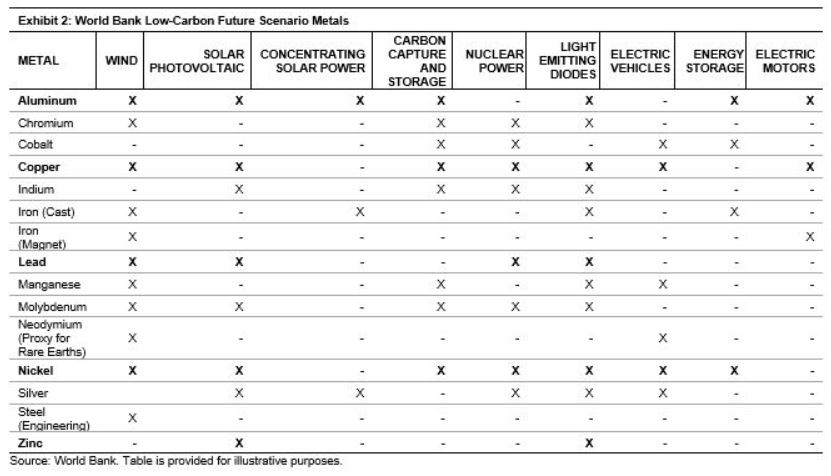
Green technologies were building momentum for years, but 2020 might be the inflection point where they truly took off. Besides rare earth metals, the building blocks for many of these technologies come from the S&P GSCI Industrial Metals and S&P GSCI Precious Metals. All five constituents of the S&P GSCI Industrial Metals are used in low-carbon technologies, with aluminum, nickel, and copper used the most. Within the precious metals space, silver is used extensively in solar photovoltaics, LEDs, and electric vehicles. Exhibit 2 shows metal use in select low-carbon technologies.

Any of the S&P GSCI Single Commodities Indices could be used to implement tactical views on the direction of a single commodity. S&P Dow Jones Indices calculates hundreds of indices based on commodities around the world in real time. Check out our website for more information.
The posts on this blog are opinions, not advice. Please read our Disclaimers.
Content Type
Location
Language