Featured Topics
Featured Products
Events
S&P Global Offerings
Featured Topics
Featured Products
Events
S&P Global Offerings
Featured Topics
Featured Products
Events
S&P Global Offerings
Featured Topics
Featured Products
Events
Financial and Market intelligence
Fundamental & Alternative Datasets
Government & Defense
Banking & Capital Markets
Economy & Finance
Energy Transition & Sustainability
Technology & Innovation
Podcasts & Newsletters
Financial and Market intelligence
Fundamental & Alternative Datasets
Government & Defense
Banking & Capital Markets
Economy & Finance
Energy Transition & Sustainability
Technology & Innovation
Podcasts & Newsletters
ECONOMICS COMMENTARY — Nov 02, 2021
Worldwide manufacturing output growth slowed in October to the weakest so far in the recovery from the initial pandemic lockdowns, constrained by record supply delays which resulted in one of the steepest price increases seen in over two decades of survey history. While signs of output reviving in parts of Asia provide encouragement that the global supply situation may start to improve, manufacturers' optimism about the year ahead has dipped to a one-year low amid concerns over persistent supply chain bottleneck, inflation and a near-stalling of global trade.
We review the latest PMI data with 10 key charts.
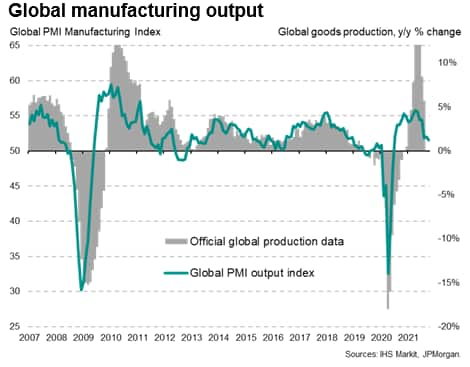
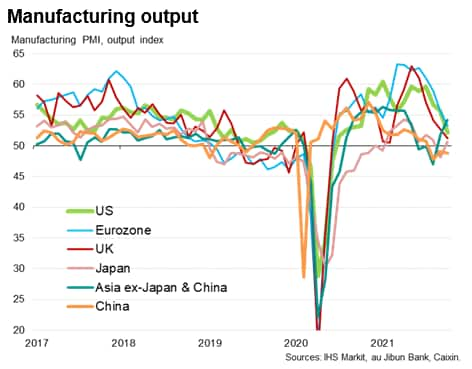
Global manufacturing output growth slowed in October to the lowest recorded since the recovery from the initial pandemic lockdowns began in July of last year. The JPMorgan Manufacturing PMI Output Index, which measures monthly production changes, fell from 52.1 in September to 51.6, to signal a further cooling of the worldwide manufacturing expansion from July's recent peak, when the index hit 55.7 - its highest for over a decade.
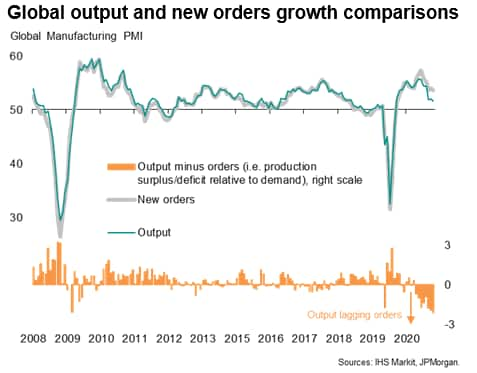
Although October also saw manufacturing new orders growth weaken to the second lowest in just over a year, the slowing of production growth was even steeper. Manufacturing output consequently lagged behind growth of new orders to the greatest extent recorded during an expansion since 2004, resulting in yet another large rise in backlogs of uncompleted work globally during October.
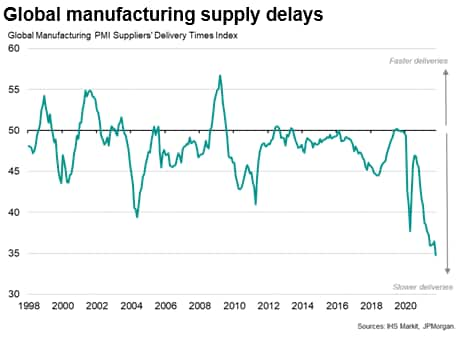
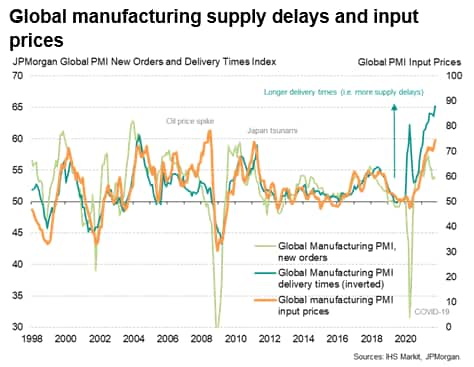
This shortfall of production could be to a large extent explained by ongoing supply constraints, in part relating to labour but more widely for raw materials. Suppliers' delivery times lengthened globally at a rate unprecedented over almost a quarter of a century of survey history, with the rate of deterioration accelerating markedly during the month.
Supply delays were associated with a number of causes, ranging from suppliers lacking production capacity to shortages of shipping and container availability and port congestion.
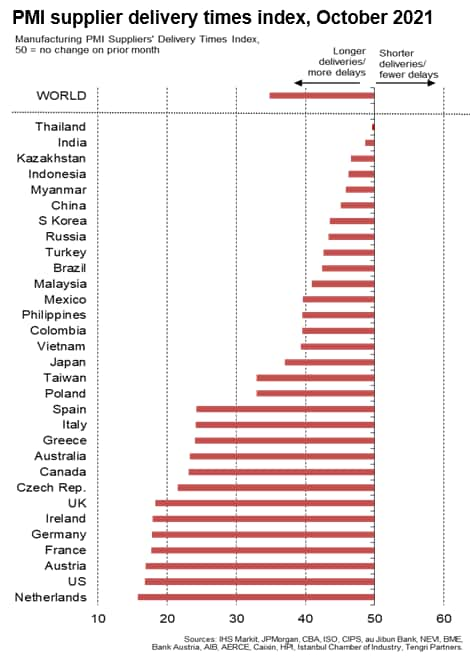
Every economy covered by IHS Markit's surveys saw longer lead times in October, with the highest incidence of delays recorded by countries located in North America and Europe. Far fewer delays were reported across Asia, though even in Asia the average lengthening of lead times was the greatest since the first lockdowns of early 2020.
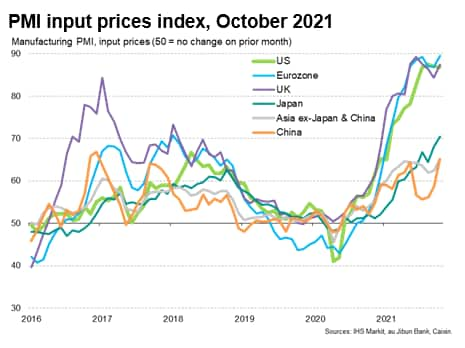
A consequence of the ongoing supply crisis was yet another surge in prices. The global PMI manufacturing input prices index rose to a it's third highest on in October (behind only June and July 2008), indicating that, excluding the oil price spike in the summer of 2008, the recent price pressures have greatly exceeded anything seen in the survey's prior 23-year history.
All economies reported higher input costs (with the vast majority reporting higher rates of inflation), but the steepest increases were seen in the eurozone, led by Greece, Austria, Germany and the Netherlands, followed by the UK and US.
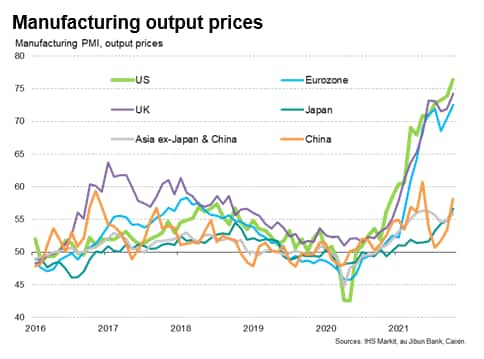
Higher costs fed through to higher prices. Globally, the rate of inflation of goods sold at the factory gate hit a survey high in October, with new records witnessed in the US, UK and Eurozone. Rates of inflation also rose markedly in Japan, China and South East Asia.
The concentration of supply delays in North America and Europe meant these economies also saw especially weaker production growth during October. A 15-month low was seen for production growth in the US while the Eurozone and UK recorded the weakest expansions for 16 months and eight months, respectively.
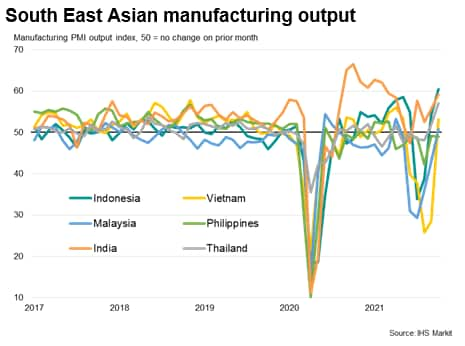
However, while the US and Europe slowed, it was a different story in South East Asia, where production rebounded from recent restrictions associated with the spread of the COVID-19 Delta wave.
Leading the Asian rebound was Indonesia, which recorded the steepest rise in output in just over 10 years of survey history, followed by India, where growth hit a seven-month high. These economies have now recorded growth for two and four successive months respectively after rising infections caused production losses in prior months.
Thailand also reported a survey-record production gain as the recovery gained traction for a second month. Both Vietnam and Malaysia meanwhile saw production return to growth after multiple months of falling output linked to COVID-19.
The reviving expansion seen in South East Asia meant Asia ex-Japan and China as a whole reported the strongest output increase since April. Having lagged the rest of the world with output declining in August, the region is now recording stronger growth than Europe and North America.
However, disrupted production meanwhile remained a feature of manufacturing in mainland China, where output fell for a third month running. But there was better news out of Japan, which joined the broader Asian recovery by returning to growth after September's decline.
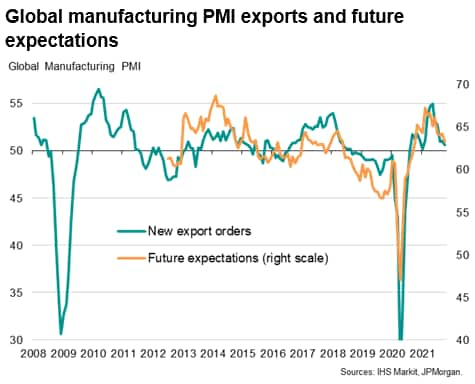
The revival of production in South East Asia adds to hopes that some of the pressure on global supply chains will ease in coming months, as exports from these countries find their way to factories in the west. The concern, however, is that shipping remains highly congested, with a lack of containers and port capacity representing particular bottlenecks. These bottlenecks were linked to a drop in global export growth to a near stand-still in October, suggesting that global trade is growing at its slowest rate since January.
This combination of stalling trade and persistent bottlenecks, combined with rising prices, pushed manufacturing sentiment about the outlook to its lowest for a year in October, suggesting that producers are bracing themselves for tough times to come in the near-term at least.
Chris Williamson, Chief Business Economist, IHS Markit
Tel: +44 207 260 2329
chris.williamson@ihsmarkit.com
© 2021, IHS Markit Inc. All rights reserved. Reproduction in whole or in part without permission is prohibited.
Purchasing Managers' Index™ (PMI™) data are compiled by IHS Markit for more than 40 economies worldwide. The monthly data are derived from surveys of senior executives at private sector companies, and are available only via subscription. The PMI dataset features a headline number, which indicates the overall health of an economy, and sub-indices, which provide insights into other key economic drivers such as GDP, inflation, exports, capacity utilization, employment and inventories. The PMI data are used by financial and corporate professionals to better understand where economies and markets are headed, and to uncover opportunities.
This article was published by S&P Global Market Intelligence and not by S&P Global Ratings, which is a separately managed division of S&P Global.
Location

