Featured Topics
Featured Products
Events
S&P Global Offerings
Featured Topics
Featured Products
Events
S&P Global Offerings
Featured Topics
Featured Products
Events
S&P Global Offerings
Featured Topics
Featured Products
Events
Financial and Market intelligence
Fundamental & Alternative Datasets
Government & Defense
Banking & Capital Markets
Economy & Finance
Energy Transition & Sustainability
Technology & Innovation
Podcasts & Newsletters
Financial and Market intelligence
Fundamental & Alternative Datasets
Government & Defense
Banking & Capital Markets
Economy & Finance
Energy Transition & Sustainability
Technology & Innovation
Podcasts & Newsletters
12 Jun, 2017 | 08:00

By Nathan Stovall
Highlights
Weak first-quarter loan growth helped U.S. banks hold the line on deposit costs, but the environment is poised to change.
Core deposits are coming back in vogue, and many bankers expect the cost of that prized funding to rise as the pace of rate increases continues.
Weak loan growth in the first quarter helped U.S. banks hold the line on deposit costs, but the environment is poised to change.
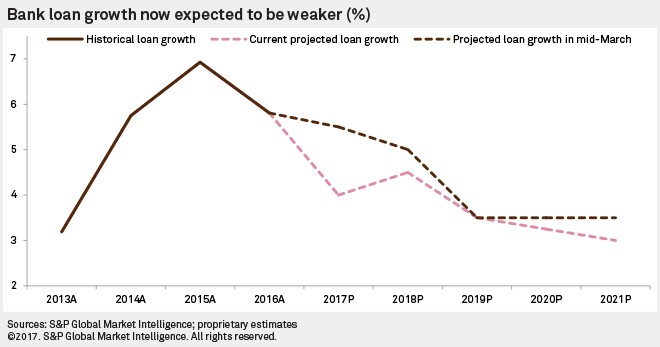
S&P Global Market Intelligence has lowered its loan growth forecast since the lackluster first quarter, but we still expect loans to increase during the remainder of 2017 as the economy remains on strong footing. Bankers have maintained that borrower sentiment has improved since the U.S. election in November. Although they say the increased optimism has not yet translated into growth, pent-up demand could help foster loan origination activity in the latter half of the year.
While commercial real estate and commercial & industrial loans each posted linked-quarter growth in excess of 1%, declines in mortgage, credit card, and consumer loans dragged down loan balances across the industry in the first quarter.
But the Federal Reserve's H.8 report, which tracks commercial bank balances on a weekly basis, shows that loan growth has returned. Increases in loans since the end of the first quarter suggest that banks could post annualized loan growth in excess of 3% in the remainder of the year.
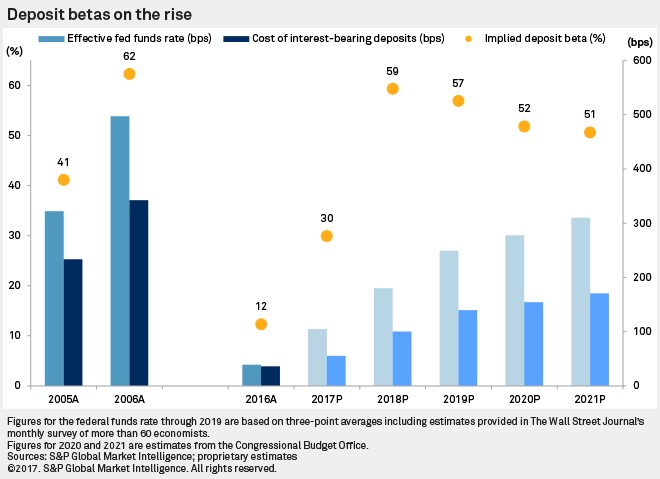
A lack of loan growth in the first quarter left banks with more dry powder on their balance sheets. Banks have reported only modest increases in funding costs amid a series of gradual rate increases from the Federal Reserve since December 2015. While the target rate for the key benchmark has risen 75 basis points, deposit costs only rose to 0.40% in the first quarter of 2017 from 0.33% in full-year 2015, and 0.36% in 2016.
But stronger loan growth will put pressure on liquidity. As banks put more funds to work and interest rates are expected to move higher, the industry's deposit beta is projected to reach 30% in 2017. The deposit beta indicates how much of the change in the effective fed funds rate banks pass onto customers. The first-quarter deposit beta of 13% was slightly higher than the level experienced in 2016 but well below what was seen during the last rate tightening cycle between 2004 and 2006. We expect this measure to reach 59% in 2018 after the impact of higher rates takes hold.
Core deposits are coming back in vogue, and many bankers expect the cost of that prized funding to rise as the pace of rate increases continues. Some bank observers have also argued that the Fed's efforts to shrink its balance sheet could create liquidity pressures, forcing banks to either shrink their balance sheets or pay higher rates to defend their deposits.
The Fed has not yet taken significant balance sheet actions, and its latest rate hike in March was not felt by banks in the first quarter since it came with just a few weeks left in the period. Bankers expect deposit betas to move higher if the Fed continues raising rates this year. Economists expect the Fed to raise rates again in June and once more before the end of 2017.
Higher rates will also provide a further lift in earning-asset yields, allowing banks to report further expansion in net interest margins. While the yield curve has flattened since the end of the first quarter, economists expect long-term rates to rebound. Banks have already shown that earning-asset yields are rising from recent historical lows.
The industry has also positioned loan portfolios to benefit from further rate increases. Banks' asset repricing disclosures show that close to 32% of loans were set to reprice in the next 12 months at the end of the first quarter, compared to 31% at year-end 2016 and nearly 27% at year-end 2005, when the last tightening cycle was underway.
Expansion in key earning-asset yields over the next few years should provide a tailwind for bank earnings as credit quality remains relatively clean in the near term. Bank earnings are expected to grow by 10.8% in 2017, another 4.5% in 2018, and 7.1% in 2019. We expect earnings to hold steady and then decline thereafter as credit quality sours.
Some bank industry observers have argued that the turn in the credit cycle is already here, sounding alarms over auto and credit card lending. Those observers point to weaker used car values and fierce competition for auto loans. It is also worth recognizing that delinquencies in the segment are on the rise.
Those concerned about a turn in the cycle further highlight the rising charge-off rates on credit card loans at behemoths like JPMorgan Chase & Co. and Wells Fargo & Co., which both reported notable increases in the metric in the first quarter. Such concerns are not without merit, even if delinquency figures are not yet indicative of significant new loss formation. Given the mixed trends and years of pristine credit quality, it seems clear that credit costs will continue to normalize and rise from historically low levels.
The slippage in credit quality should remain manageable in the near-term, however, allowing banks to enjoy margin expansion, assuming interest rates move higher. Should that come to pass, bank returns on equity could once again reach the double-digit mark in 2019, rising to a level not seen in the last decade.
Scope and methodology
S&P Global Market Intelligence analyzed nearly 10,000 banking subsidiaries, covering the core U.S. banking industry from 2005 through the first quarter of 2017. The analysis includes all commercial and savings banks and savings and loan associations, including historical institutions as long as they were still considered current at the end of a given year. It excludes several hundred institutions that hold bank charters but do not principally engage in banking activities, among them industrial banks, nondepository trusts, and cooperative banks. The analysis divided the industry into five asset groups to see which institutions have changed the most, using key regulatory thresholds to define the separation. The examination looked at banks with assets of $250 billion or more, $50 billion to $250 billion, $10 billion to $50 billion, $1 billion to $10 billion, and $1 billion and below.
The analysis looked back more than a decade to help inform projected results for the banking industry by examining long-term performance over periods outside the peak of the asset bubble from 2006 to 2007. S&P Global Market Intelligence has created a model that projects the balance sheet and income statement of the entire industry and allows for different growth assumptions from one year to the next.
The outlook is based on management commentary, discussions with industry sources, regression analysis, and asset and liability repricing data disclosed in banks' quarterly call reports. While taking into consideration historical growth rates, the analysis often excludes the significant volatility experienced in the years around the credit crisis.
The projections assume future fed funds rates and 10-year Treasury yields based on a monthly survey of more than 60 economists conducted by The Wall Street Journal. Interest rate assumptions for 2020 and 2021 are based on the Congressional Budget Office's annual outlook. S&P Global Market Intelligence does not forecast changes in interest rates or macroeconomic indicators and aims to project what the banking industry will look like if the future holds what most economic observers expect.
The outlook is subject to change, perhaps materially, based on adjustments to the consensus expectations for interest rates, unemployment and economic growth. The projections can be updated or revised at any time as developments warrant, particularly when material changes occur such as the implementation of the Financial Accounting Standards Board's impairment model, the current expected credit loss model, or CECL. That provision would drastically change the way banks reserve for loan losses. S&P Global Market Intelligence intends to make periodic updates as circumstances warrant.
Already a client? Read the full report and access our U.S. Bank Industry Projections Template.

