Featured Topics
Featured Products
Events
S&P Global Offerings
Featured Topics
Featured Products
Events
S&P Global Offerings
Featured Topics
Featured Products
Events
S&P Global Offerings
Featured Topics
Featured Products
Events
Language
Featured Products
Ratings & Benchmarks
By Topic
Market Insights
About S&P Global
Corporate Responsibility
Culture & Engagement
Featured Products
Ratings & Benchmarks
By Topic
Market Insights
About S&P Global
Corporate Responsibility
Culture & Engagement
S&P Dow Jones Indices — 25 Jun, 2020
By Anu Ganti
The evolution of indexing is one of the most noteworthy trends in modern financial history. The rise of passive investing is the consequence of shortfalls in active performance, as regular readers of our SPIVA reports will recognize.
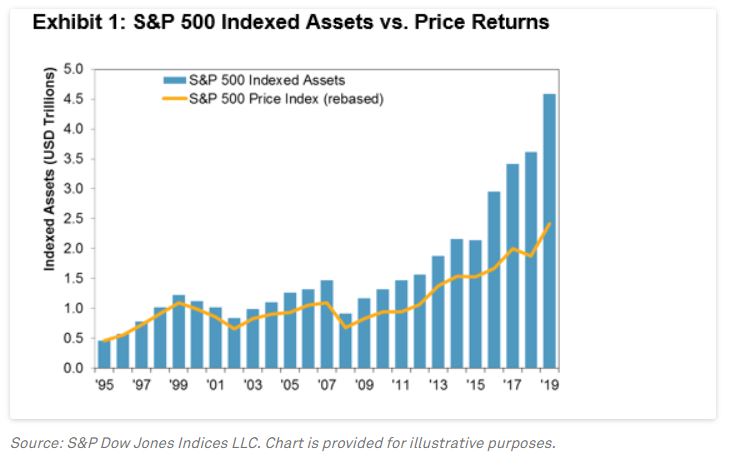
Our recent annual Survey of Indexed Assets shows a surge in S&P 500 indexed assets to $4.6 trillion as of December 2019. Exhibit 1 illustrates that the growth in assets tracking the S&P 500 dwarfed the growth due to market gains, indicating a substantial increase in flows.

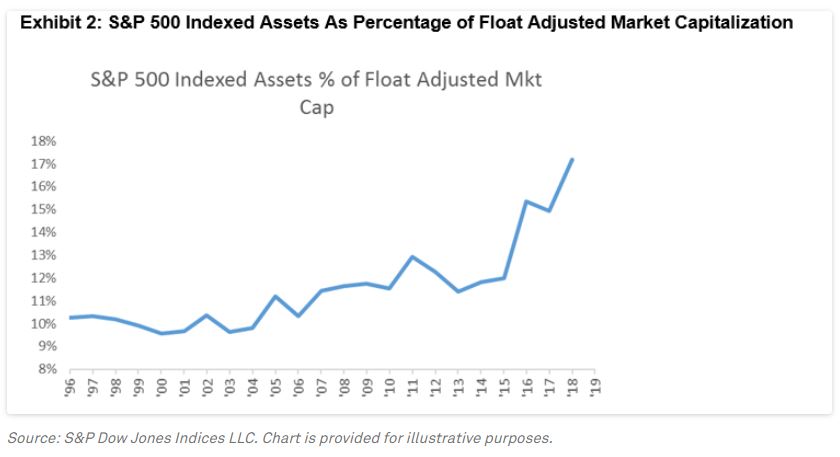
To provide context, we can analyze indexed assets historically as a percentage of float adjusted market capitalization. Exhibit 2 shows that this percentage has grown dramatically, from 10% in 1996 to 17% in 2019, highlighting the increasing importance of index funds to the overall market.

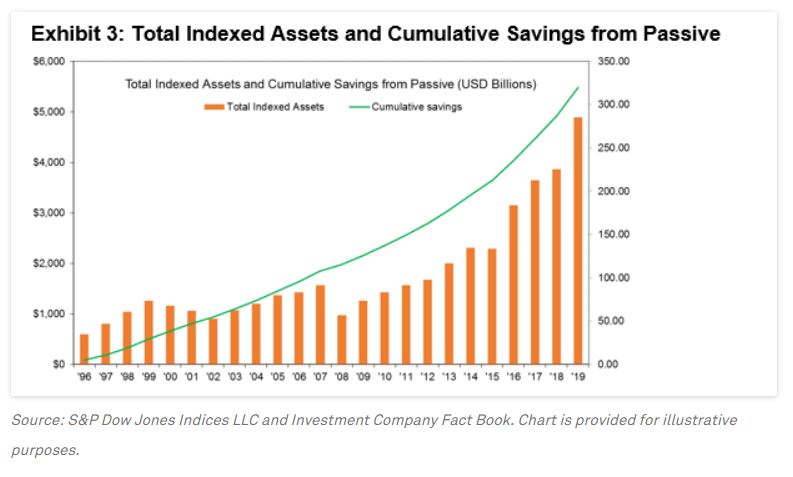
One of the reasons for the popularity of indexing is its low cost relative to active management. As indexing has grown, investors have benefited substantially by saving on fees and avoiding underperformance. We can quantify the fee savings each year by taking the difference in expense ratios between active and index equity mutual funds, and multiplying this difference by the total indexed assets for the S&P 500, S&P 400, and S&P 600. When we aggregate the results, we observe in Exhibit 3 that the cumulative savings in management fees over the past 24 years is $320 billion .

Content Type
Location
Language