


S&P Dow Jones Indices — 13 Mar, 2021
S&P Target Date Scorecard Year-End 2020
SUMMARY
- The S&P Target Date® Scorecard provides performance comparisons and analytics covering the target date fund (TDF) universe.
- The S&P Target Date Index Series offers representative benchmarks for TDFs. The series is investable, comprises consensus-derived asset allocation weights, and its composition is known in advance of evaluation periods.
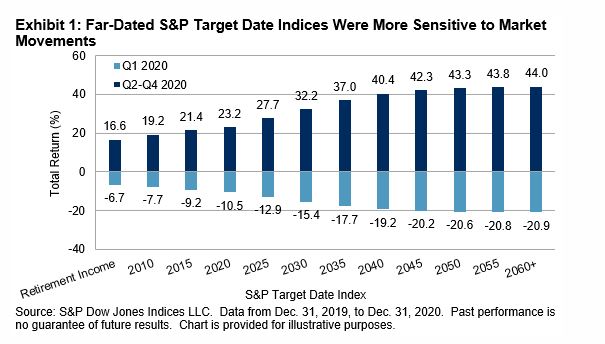
- After COVID-19 caused substantial recalibrations in Q1 2020, better-than-feared corporate earnings, bouts of optimism over the economic outlook, and vaccine rollout announcements contributed to an equity market recovery over the rest of 2020.
- Large caps led the way in 2020 as the S&P 500® (up 18%) outperformed the S&P MidCap 400® (up 14%) and the S&P SmallCap 600® (up 11%). Strong returns from some of the largest companies in the market, coupled with smaller, more domestically focused companies' greater vulnerability to the Q1 2020 "COVID correction," were key drivers.
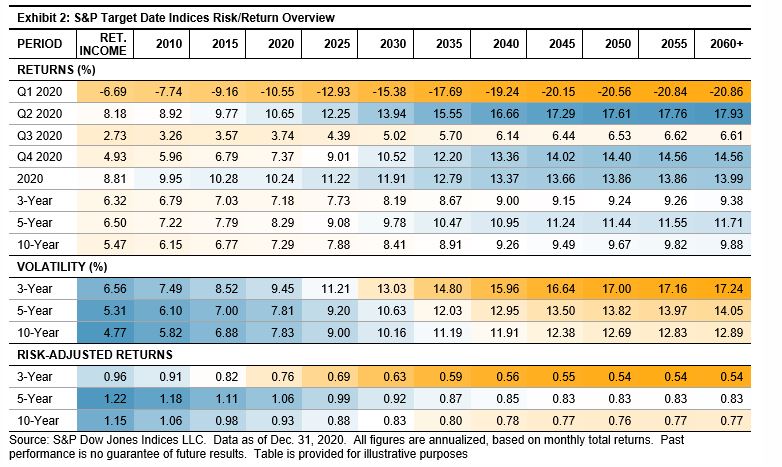
- Far-dated S&P Target Date Indices outperformed their nearer-dated counterparts last year. Higher equity allocations meant the former participated in a greater proportion of 2020's equity market recovery.
- However, on a risk-adjusted basis, the nearer-dated S&P Target Date Indices outperformed over all time horizons. The risk reduction from allocating more heavily to fixed income—a typically less volatile asset class compared with equities—more than compensated for the lower returns.
- Larger TDFs continued to outperform their smaller counterparts on average. Asset-weighted returns were higher than equal-weighted returns in all but two categories. The 2010 vintage over one- and three-year horizons offered the exceptions.
- S&P Dow Jones Indices also produces S&P Target Date Style Indices. The "TO" style indices aim to reduce the impact of market drawdowns around the expected retirement date, while the "THROUGH" style indices aim to mitigate longevity risk—the risk of outliving one's assets in retirement. Hence, THROUGH style indices have higher equity allocations than TO indices.
- THROUGH style indices posted higher returns than their TO counterparts, while lower equity allocations helped to explain TO style indices' lower volatilities. Overall, near-dated TO style indices posted higher risk-adjusted returns than their THROUGH counterparts. The opposite was true for far-dated style indices.