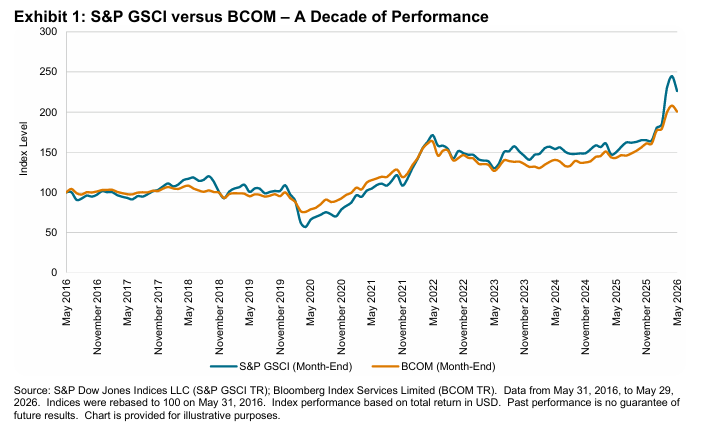
Over the 10-year period from May 29, 2016, to May 29, 2026, the S&P GSCI TR had a gain of 126.3%, outperforming the 100.6% gain for the Bloomberg Commodity Index (BCOM) TR. The 26-percentage-point spread translates to roughly 130 bps of annualized outperformance. More important than the outperformance itself is the underlying reason: how each index responds to inflation.
Regressing year-over-year total return on year-over-year headline CPI yields an inflation beta of 9.09 for the S&P GSCI and 5.50 for BCOM (R² of 51.8% and 42.2%, respectively, on 109 monthly observations). The S&P GSCI's slope is roughly 1.7× steeper. In the upper tercile of the inflation distribution, where headline CPI averaged 5.8% year-over-year, the S&P GSCI gained an average of 33.4% on a trailing 12-month basis versus 21.1% for BCOM. The 12.3-percentage-point gap appears precisely when an inflation hedge could be considered most relevant.
Production weighting drives the result. The S&P GSCI weights its constituents by a five-year rolling average of world production, which causes index weights to scale with each commodity's economic footprint. Target January 2026 rebalancing weights for Energy were 51.8% for the S&P GSCI and 29.4% in BCOM. Energy is also the largest single contributor to the variance of headline inflation. The two facts compound: an index that holds more energy moves more when energy moves, and energy often moves with the inflation cycle.
Higher beta cuts both ways. The same construction that showed a 33.4% trailing gain in high inflation regimes lost 9.7% in low inflation regimes, while BCOM averaged -4.4% in low inflation regimes. The pattern across the decade is consistent: the S&P GSCI led when inflation was elevated and lagged when it was not. That said, as we’ll see later, the S&P GSCI’s outperformance during high inflation regimes far exceeded relative underperformance during low inflation regimes. As such, the S&P GSCI has historically exhibited characteristics associated with inflation hedging.
The Decade in Numbers
We compare the S&P GSCI and BCOM performance in total return terms for the 10-year period ending May 29, 2026, which was the most recent month-end when this study was performed. Over the course of the past decade, we’ve encountered periods of especially low inflation, such as 2020 with the COVID-19 slowdown, or high inflation, like 2021–2022 with the post-2020 inflation rebound and the start of the Ukraine-Russia conflict in 2021, and periods in between. Over the full cycle, the S&P GSCI meaningfully outperformed BCOM; however, relative performance varied within the period based on the type of inflationary regime.