


Blog — 7 Apr, 2022
Infographic Russia and Ukraine Mining by the Numbers

By Sean DeCoff
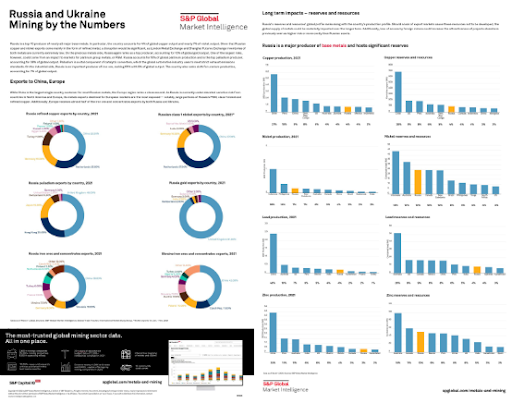
Russia is a top-10 producer of nearly all major base metals. In particular, the country accounts for 4% of global copper output and almost 7% of nickel output. Given that Russian copper and nickel exports come mainly in the form of refined metal, a disruption would be significant, as London Metal Exchange and Shanghai Futures Exchange inventories of both metals are currently extremely low.
Gain an overview of the Russian and Ukrainian mining sectors:
- Identify the key commodities and exporting countries most impacted by the conflict
- Understand the global share of Russia's and Ukraine's reserves and resources, and mine production by key commodities
- Exploration trends of Russia and Ukraine