Featured Topics
Featured Products
Events
S&P Global Offerings
Featured Topics
Featured Products
Events
S&P Global Offerings
Featured Topics
Featured Products
Events
S&P Global Offerings
Featured Topics
Featured Products
Events
Financial and Market intelligence
Fundamental & Alternative Datasets
Government & Defense
Banking & Capital Markets
Economy & Finance
Energy Transition & Sustainability
Technology & Innovation
Podcasts & Newsletters
Financial and Market intelligence
Fundamental & Alternative Datasets
Government & Defense
Banking & Capital Markets
Economy & Finance
Energy Transition & Sustainability
Technology & Innovation
Podcasts & Newsletters
ECONOMICS COMMENTARY — Jan 22, 2024
Gross Domestic Product (GDP) serves as a key indicator of an economy's health, reflecting the total value of goods and services produced. However, challenges exist in relying solely on GDP for economic analysis. These include delays in the publication of data, early estimates being subject to revision, and the employment of varying methodologies to calculate GDP by different countries. These challenges can lead to data and international comparisons that may be misleading, making it crucial for decision-makers to approach GDP data with caution.
Purchasing Managers' Index (PMI) surveys offer a valuable alternative, providing monthly data that are not revised after initial publication and are collected internationally using consistent methodologies. Research indicates a strong correlation between PMI and GDP, with PMI serving as an early and reliable indicator, potentially improving the accuracy of early GDP estimates. In conclusion, while GDP remains a widely used economic indicator, the incorporation of alternative measures, such as PMI surveys, can enhance the understanding of economic performance and guide more informed decision-making.
The most widely used barometer of an economy's health is typically gross domestic product (GDP), which is a statistic compiled by government agencies around the world intended to capture the total amount of goods and services produced at any given time. In the vast majority of cases, GDP data are calculated on a quarterly basis, with the focus resting on the degree to which the total has changed from one period to the next. This resulting gauge of economic growth is used to not only assess the pace of expansion or contraction, but to also compare performance across economies.
There are drawbacks in using GDP for these purposes, however, which can potentially mislead.
1. Differing methodologies: Despite there being an international standard methodology for the calculation of GDP, in practice different countries use differing techniques. The standard allows for GDP to be captured either by measuring output, expenditure or income of a country's businesses, individuals and government agencies. In some countries (such as the UK), the primary focus lies in measuring the total output of all activity, while in others (such as the US) the primary focus lies in capturing how much is spent. In theory, the total amount of expenditure should equal the total output of an economy, and also the income generated from that output and expenditure, once allowances are made for factors such as imports, exports and inventory changes. But in reality, these different methodologies can diverge quite markedly, especially if some of the variables (such as inventories) need to be estimated.
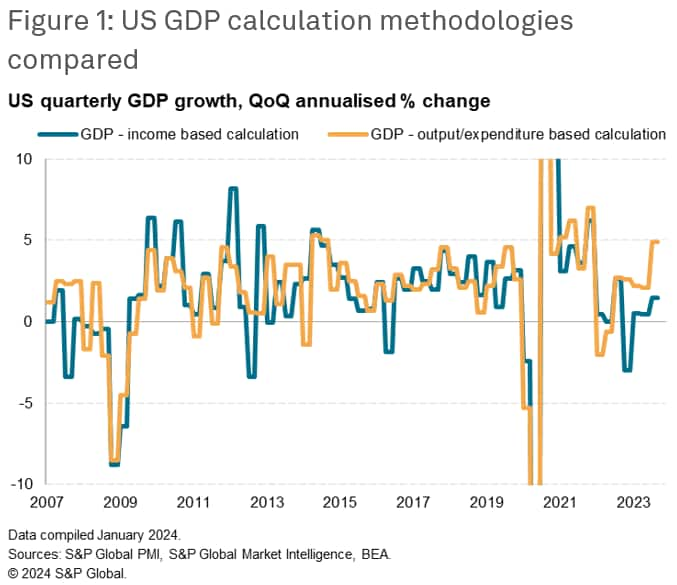
An example is shown in figure 1, which plots two measures of US GDP, one using expenditure based calculations and one based on income data. Clearly there are major divergences in the pattern of economic growth being signaled. Hence, international comparisons which use different methods of calculating GDP are effectively comparing apples and oranges or, at best, very different types of apples.
The Federal Reserve Bank of St Louis dives into these methodological divergences between output and income based measures of GDP further, and notes that "it may be prudent to use both series (or perhaps a measurement combining both) to measure output".
2. Estimation errors: Any delays in the publication of GDP data make the statistics less useful for decision making, especially for policymaking - notably in the setting of interest rates - and investing. In order to publish data quickly, some elements of the GDP total are estimated. This may be because some components of GDP cannot be fully measured in a comparable way (it's relatively easy to conceptualize the quarterly output of a car factory but less easy to work out the quarterly output of a hospital or school). Or it may be because some data needs to be estimated by surveys. Consumer spending, for example, is generally estimated by a household survey. In some countries, these surveys have struggled to sustain sufficient sample sizes to generate robust data. In the UK, for example, the quarterly estimate of consumer expenditure, which accounts for some 60% of total spending in the economy, is estimated by the statistical agency from a sample of just 1,200 households. Not only is this sample small (there are 28.2 million households in the UK), but these households are also relied upon to accurately record and report their day-to-day spending on all goods and services, which is likely to be prone to some potentially marked errors.
Estimation is also needed as some data are only available on an annual basis instead of quarterly, and in some cases delays in the availability of quarterly data mean the government's statisticians need to fill some gaps with approximations, often based on prior data and analysis of recent trends. In some cases, proxies are even relied upon (such as using the total number of people employed in a government agency to act as a proxy for output).
Given the varied nature of these estimates, it's easy to see how potentially large errors can be introduced into the GDP figures.
Furthermore, when looking at the change between GDP estimates for two periods, the errors inherent in each data point mean any calculation of the difference between these two error-prone numbers (i.e. the GDP growth rate) is potentially susceptible to a particularly large error.
Hence many economists take GDP data with a healthy dose of salt, especially early estimates.
3. Revisions: In recognition of the potential errors caused by estimating some components of GDP, statistical bodies generally publish several versions of each quarter's GDP (known as different "vintages") as more time allows more information to become available. As these early GDP estimates tend to be based on only partial data, they are revised in future estimates. While an initial GDP estimate typically comes out around one month after the end of each quarter, a so-called revised "final" estimate tends to be issues around three months after the end of the quarter. The revisions between these first and "final" estimates can be significant, and in the UK prior to the pandemic range from -0.3% to -0.5%.
However, the revisions don't necessarily stop there. Every year, the statistical agencies will receive more information on issues such as how the structure of the economy changed in the past few years, including company births and deaths, more comprehensive tax data and other annually updated statistics. These can lead to quite fundamental changes in the recent historical trend of GDP, meaning the so-called "final" GDP turn out not to be so final after all.
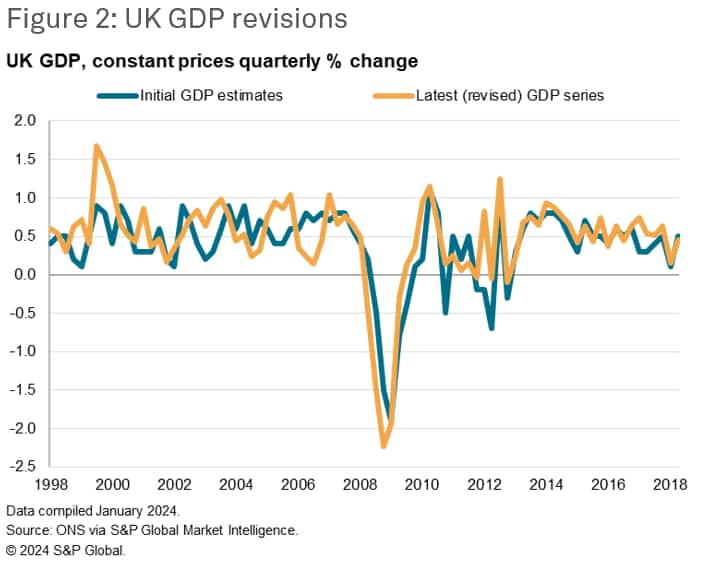
Again, using the UK as an example, the economic downturn due to the pandemic was revised in 2023 to show a contraction that was 2% less than previously thought. However, it's not just the pandemic that led to revisions. As figure 2 shows, these later revisions are common and often extensive, effectively retelling economic history, with - for example - a notable "double dip recession" after the financial crisis being revised away.
These subsequent revisions have seen the UK GDP being revised from the initial estimates by as much as -1.0% to +1.0%. These revisions make something of a mockery of financial markets getting excited about an initial GDP release missing expectations by margins as little as 0.1%.
You can read more about revisions to US GDP data on the Bureau of Economic Analysis website here, which includes a discussion of whether the early GDP figures should be published as point estimates or published as a range of values based on probabilities.
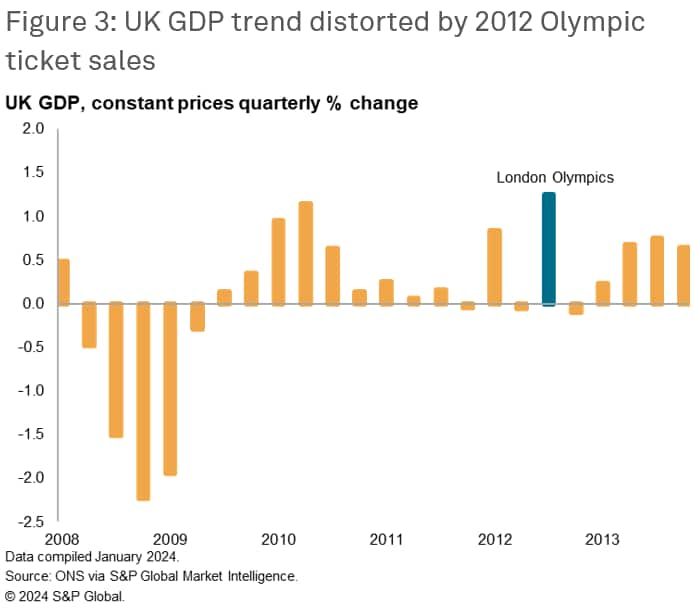
4. One-off factors. A further consideration when looking at GDP data is the extent to which one-off factors may have distorted the data, masking the broader economic growth trend. For example, events such as Olympic ticket sales (see fig. 3), additional public holidays, major exports of small numbers of high value items (from rare minerals and diamonds to airplanes), or changes in defense spending. While these are genuine additions or subtractions to GDP, their impact will need to be properly understood in the analysis of GDP data, and it is often the case that the underlying pace of economic growth absent these one-off factors cannot be accurately estimated.
The value of GDP data to decisions makers is therefore limited by the fact that the data tend to be only published on a quarterly basis, are subject to potentially major revision after initial publication, are not strictly-speaking internationally comparable, and that signals can be dwarfed by one-off factors.
Policy errors from central banks have in the past been blamed on misleading signals from early GDP estimates, notably in the early stages of the global financial crisis, when strong GDP data for the Eurozone and UK lured policymakers into believing economic growth was resilient, only for the GDP data to be subsequently revised down. Some examples of these misleading GDP signals are explored more fully in our cases studies, linked to at the end of this document.
Given the limitations of GDP, alternative measures of economic performance are often used to better understand the prevailing economic climate, and to better steer business, investment and policy decisions. The most widely used alternative indicators are the PMI surveys, compiled globally by S&P Global.
The PMI (Purchasing Managers' Index) is based on data collected from representative panels of companies, providing early indications of changing economic conditions in over 40 countries. The data offer several advantages over GDP data:
The PMI is produced on a monthly basis, allowing faster identification of turning points in the economic environment compared to quarterly GDP numbers.
The PMI is produced rapidly, providing the first available indications of changing economic conditions in most countries. Data are published at the start of each month, referring to the month just passed (with 'flash' PMI data released even earlier). This means PMI data are available several months ahead of GDP estimates.
The PMI data are not revised after first publication, giving analysts confidence that the numbers they are using will not change with subsequent data releases.
The PMI data are compiled using identical methodologies internationally, allowing easy comparison of data around the world, as well as easy aggregation into global or regional aggregates.
The PMI methodology, being a diffusion index, means large changes in any one company or segment of the economy do not dwarf the overall signal.
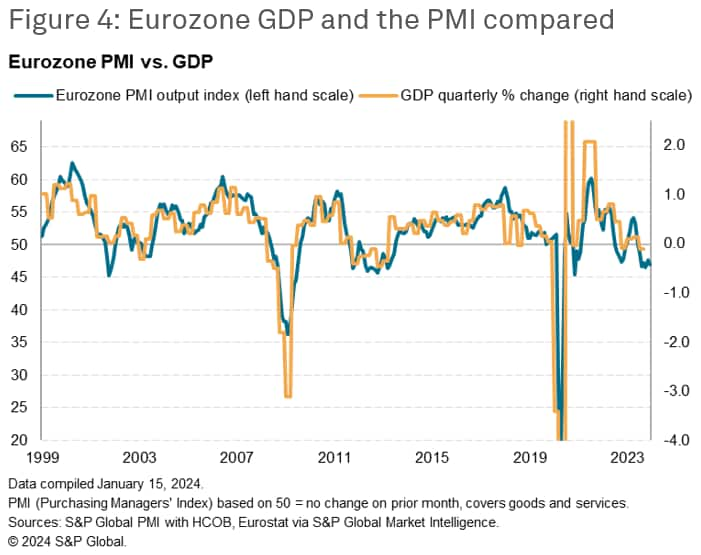
There is now a wealth of research demonstrating how the PMI survey data can be used to either anticipate or track GDP or offer alternative versions of economic growth. At its most simplistic level, the PMI survey output index, covering the production of both goods and services, is a comparable measure of changes in GDP with which it tends to exhibit a high statistical correlation. The example of the Eurozone PMI against quarterly changes in GDP is shown in Fig. 4. The correlation (prior to the pandemic, when major distortions to GDP were created by widespread industrial closures) between the two series is 78%, which increases to 89% if a two-quarter average of GDP is used, as in Fig. 5 (this averaging reduces some of the volatility in the GDP data, often attributable to one-off factors).
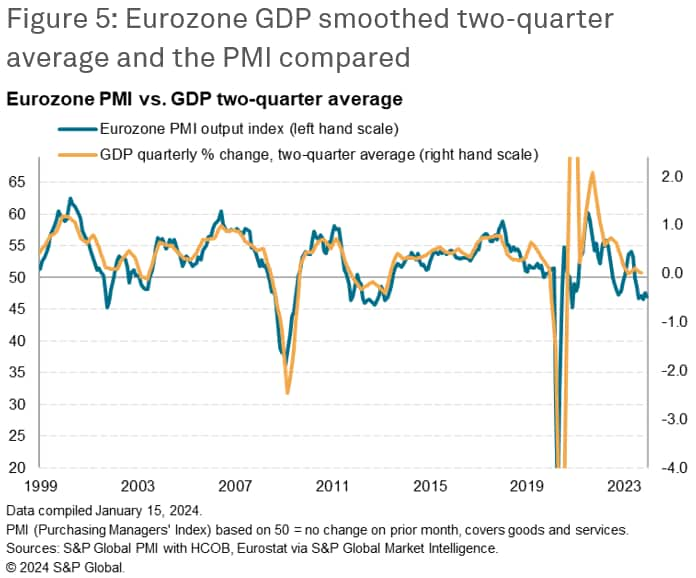
A simple OLS regression can be used to determine a GDP-equivalent value for any given PMI reading simply by using the PMI output index as the explanatory variable of changes in GDP. Some other ideas are described more fully using eViews.
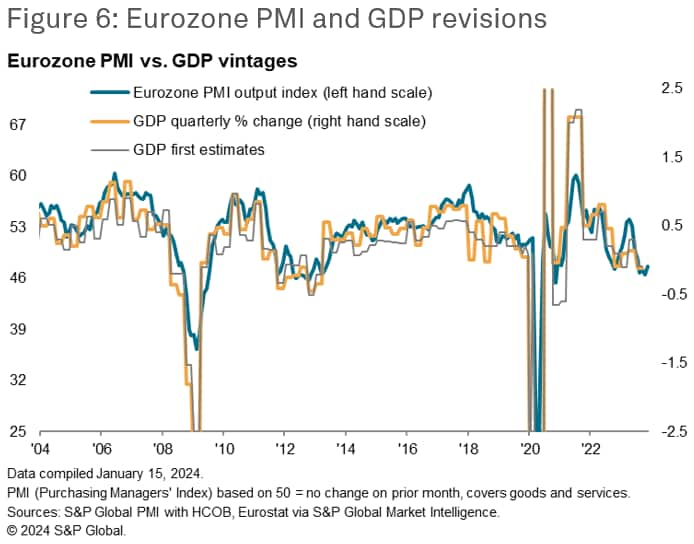
Such a model is explored by the European Central Bank, which found that for the euro area "a tracker for real GDP growth using only the Purchasing Managers' Index (PMI) composite output is of similar accuracy for the final GDP release as the first GDP release", yet the PMI is of course available far earlier than even the most advance GDP release.
This ECB research offers the additional insight that the PMI can be used to model potential errors in early GDP estimates, concluding that "These findings imply that PMI surveys are not only valuable for analysts and policymakers as a timely and reliable GDP tracker, but also for statisticians to potentially improve the accuracy of the first preliminary flash estimate of euro area real GDP."
The ability of the PMI to provide a better guide to final GDP than early, error-prone GDP estimates is clearly illustrated by Fig. 6.
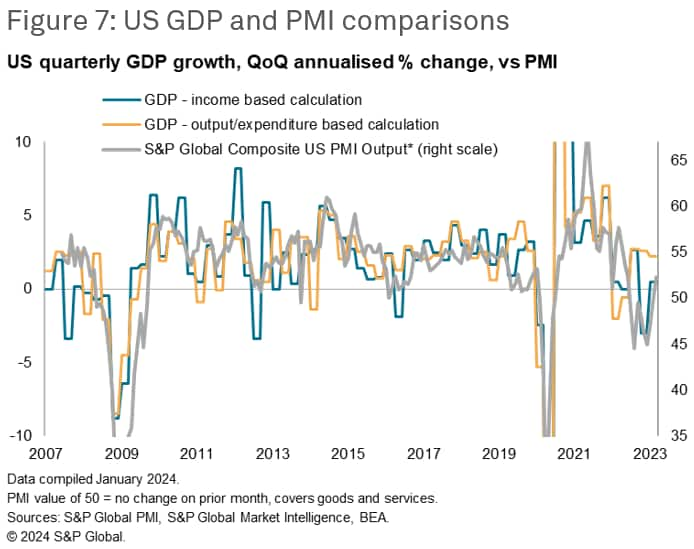
In the case of the US, see Fig 7, the PMI data can likewise help better understand the underlying health of the economy, cutting through some of the noise of the GDP data to help extract growth signals, and to also help better understand variances between the various measures of GDP calculation. As in Europe, the US PMI also offer guidance on the extent to which early GDP may get revised, as noted by Unicredit research: "business surveys such as the PMIs have predictive power for GDP revisions, meaning they are a better guide to the mature - rather than the initial - estimates of growth."
In summary, the PMI offers advantages over GDP as an economic indicator. Unlike GDP, which is quarterly and subject to revisions, PMI is monthly, available months ahead of GDP estimates, and remains unaltered after initial publication, instilling confidence in its reliability. Standardized international methodologies allow easy global comparisons, and the PMI's diffusion index prevents individual factors from overshadowing the overall signal. Research demonstrates a high correlation between PMI and GDP, making PMI a timely and accurate tracker which is especially valuable for analysts, policymakers, and statisticians in improving the precision of early GDP estimates.
Case study: PMI data sent early signals of GFC impact on Eurozone GDP | S&P Global (spglobal.com)
Case study: anticipating the UK recession during the global financial crisis (spglobal.com)
Chris Williamson, Chief Business Economist, S&P Global Market Intelligence
Tel: +44 207 260 2329
© 2024, S&P Global. All rights reserved. Reproduction in whole or in part without permission is prohibited.
Purchasing Managers' Index™ (PMI®) data are compiled by S&P Global for more than 40 economies worldwide. The monthly data are derived from surveys of senior executives at private sector companies, and are available only via subscription. The PMI dataset features a headline number, which indicates the overall health of an economy, and sub-indices, which provide insights into other key economic drivers such as GDP, inflation, exports, capacity utilization, employment and inventories. The PMI data are used by financial and corporate professionals to better understand where economies and markets are headed, and to uncover opportunities.
This article was published by S&P Global Market Intelligence and not by S&P Global Ratings, which is a separately managed division of S&P Global.
Location

