Featured Topics
Featured Products
Events
S&P Global Offerings
Featured Topics
Featured Products
Events
S&P Global Offerings
Featured Topics
Featured Products
Events
S&P Global Offerings
Featured Topics
Featured Products
Events
Language
Featured Products
Ratings & Benchmarks
By Topic
Market Insights
About S&P Global
Corporate Responsibility
Culture & Engagement
Featured Products
Ratings & Benchmarks
By Topic
Market Insights
About S&P Global
Corporate Responsibility
Culture & Engagement
S&P Dow Jones Indices — 9 Apr, 2020
By Berlinda Liu
This article is reprinted from the Indexology blog of S&P Dow Jones Indices.
Launched in August 2018, the S&P Risk Parity Indices were designed to be a transparent, passive alternative to active risk parity funds. The index series comprises several indices that are differentiated by volatility targets in an 8%-15% range.
This blog compares the original and new methodologies.
After consultations with stakeholders, S&P Dow Jones Indices has updated the methodology, effective April 6, 2020. Under the original methodology, realized volatilities of the indices generally fell below target. However, the new methodology is expected to ensure realized volatility is closer to the target. The S&P Risk Parity Indices rebalance monthly, and unlike the original methodology which uses historical weights, under the new approach the current rebalance weights are applied to get a more realistic estimate of forward volatility.
As Exhibit 1 shows, the original methodology’s realized volatility was short of its target volatility over the back-tested period. This isn’t surprising since the market has mostly experienced declining volatility over the past decade. Moreover, if market volatility had trended in the opposite direction, it is reasonable to expect that the index would have realized above its target.
The new methodology addresses this issue by holding constituent weights constant over the entire 15-year look-back period and using them to calculate volatilities and adjust leverage, thereby, delivering a realized volatility that is closer to the target over long- and mid-term horizons (Exhibit 1).

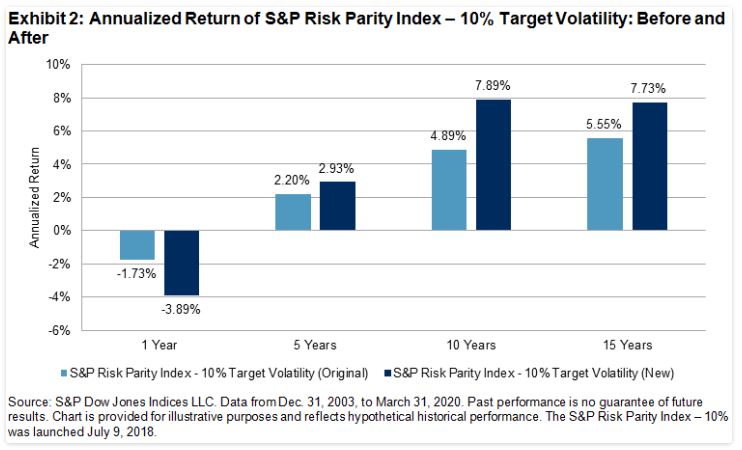
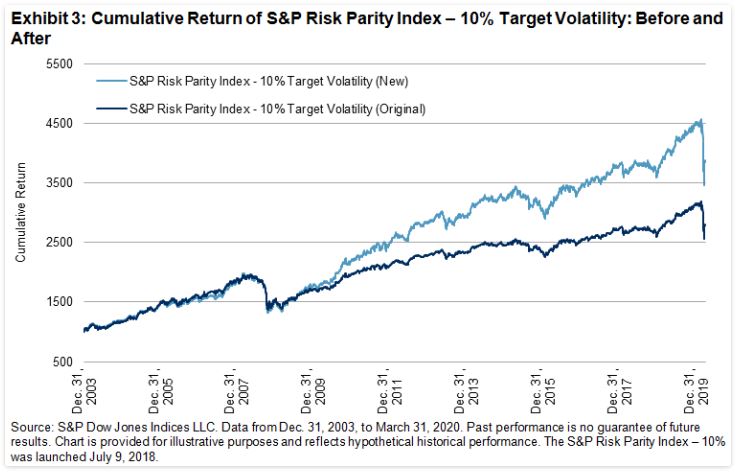
Relatively higher risk in the new index methodology was more than offset by higher returns, leading to a return/risk ratio of 0.76 compared to 0.66 with the original methodology (see Exhibits 2 and 3).


Lastly, to aid with replication, the index will now use security-specific roll schedules and use S&P 500® e-mini futures instead of a standard futures contract.
Since the methodology changes have a material impact on historical risk profiles, the entire time series has been restated.
With the above changes we believe the index will realize closer to its target volatility over the long-term.