


S&P Dow Jones Indices — 22 Apr, 2021
One Year after the Rapid Reset

This article is reprinted from the Indexology blog of S&P Dow Jones Indices.
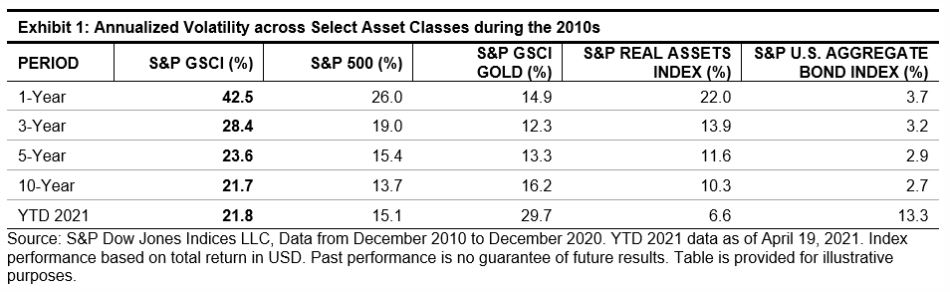
What a difference a year makes. April 21, 2021, marks the one-year anniversary of the S&P GSCI’s low. Since then, we have entered a different economic, social, and geopolitical environment, and the S&P GSCI was up 60% as of April 19, 2021. On March 26, 2020, three days after the low in the S&P 500®, I wrote a blog called Rapid Reset, discussing the market sentiment, what to look for in the short term, and potential structural shifts in commodities markets. This included the potential for a peak in commodities supply after many years of gluts in most commodities. Since this time last year, a dramatic reduction in oil production, loss of agriculture crop supply, and huge draws on industrial and precious metals coalesced to push commodities prices in some cases to new all-time highs. With changes in market dynamics, highly volatile scenarios played out, and the start of the 2020s displayed some of the highest volatility in recent history.
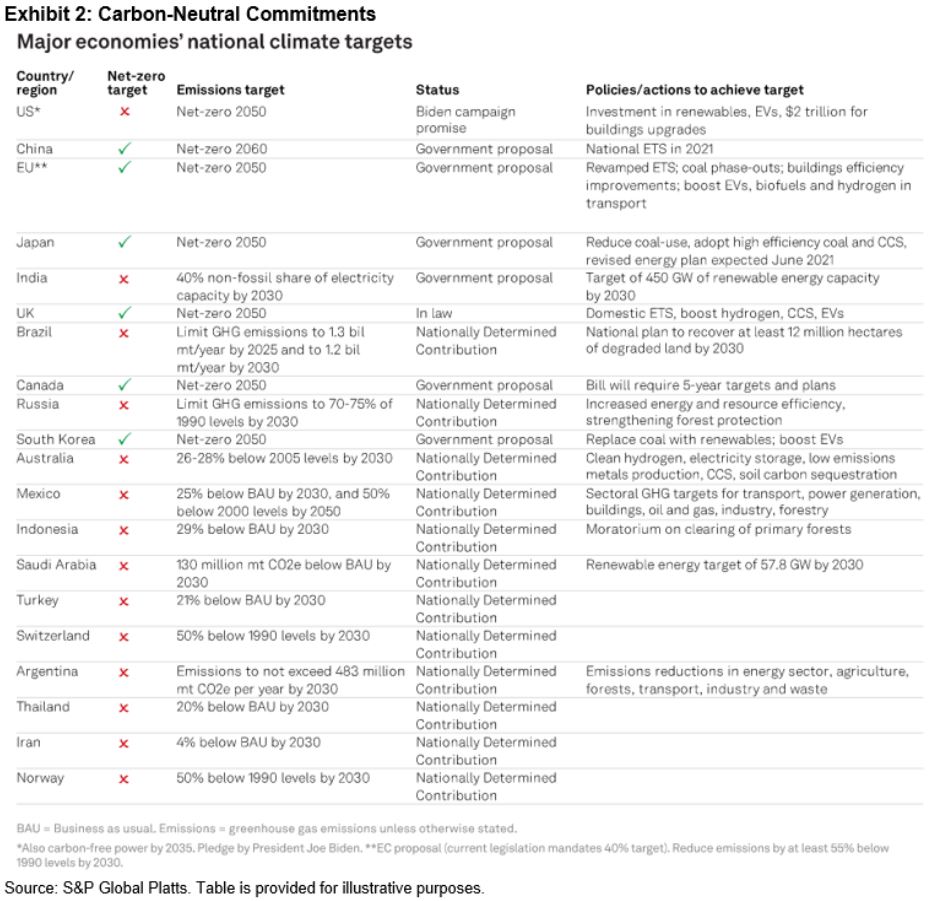
How have the commodities markets shifted to start this new decade? Themes that played out in the 2010s seem to have either hit the brakes or accelerated over the past year. The most prominent change involved energy. One year out from front-month futures crude oil prices dipping into negative territory, it seems unlikely that the oil producers still in business will ever again pump oil without regard for systemic macroeconomic risks. U.S. shale producers just posted the most bankruptcies for a first quarter since 2016, despite crude oil prices being up 30% YTD. With a global focus on green infrastructure and battling climate change, the energy transition has commenced. The world may never again be “swimming in oil.” Electric vehicles are a major driver behind the energy transition, as demand for fossil fuels will likely decrease over the long run. With more and more countries committing to carbon-neutral timelines, oil companies will have to adapt to stay relevant. Exhibit 2 shows the latest country net-zero and emissions targets compiled by S&P Global Platts, a division of S&P Global.
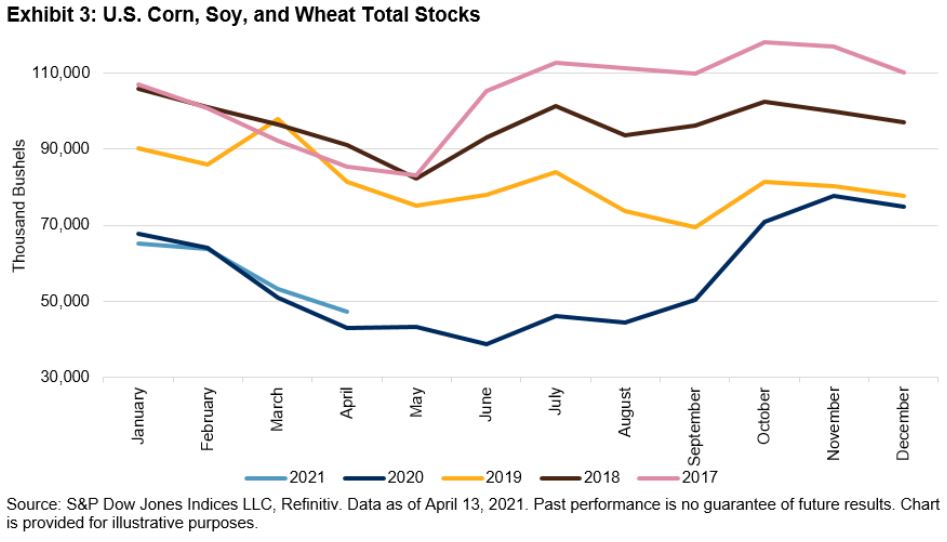
The last quarter of 2020 also marked a turning point in the grains market. For the first time in years, we witnessed a surprise to the downside in grain production in the western hemisphere. Several factors including weather events, farmers reducing acreage due to low prices, and lack of government subsidy assistance all played a role in this bullish supply-driven story. At the end of March 2021, market participants were surprised again by the USDA releasing a dramatically lower-than-expected reading for U.S. grain plantings this season. The tailwinds continued for the grain sector as corn and soybeans made new five-year highs.
Finally, industrial metals continued their bullish path off the lows and showed how closely tied they are to the post-pandemic economic recovery. Metals have an added benefit from the demand side, as most traded metals are used in some form or capacity in clean energy technologies.
April marks the 30-year anniversary of the S&P GSCI, the premiere global production-weighted benchmark for commodities. The S&P GSCI has stood the test of time and remains the global benchmark most closely tied to inflation and global economic growth.
The posts on this blog are opinions, not advice. Please read our Disclaimers.
Content Type
Theme
Segment
Language