Featured Topics
Featured Products
Events
S&P Global Offerings
Featured Topics
Featured Products
Events
S&P Global Offerings
Featured Topics
Featured Products
Events
S&P Global Offerings
Featured Topics
Featured Products
Events
Language
Featured Products
Ratings & Benchmarks
By Topic
Market Insights
About S&P Global
Corporate Responsibility
Culture & Engagement
Featured Products
Ratings & Benchmarks
By Topic
Market Insights
About S&P Global
Corporate Responsibility
Culture & Engagement
S&P Dow Jones Indices — 27 May, 2020
By Akash Jain
This article is reprinted from the Indexology blog of S&P Dow Jones Indices.
Globally, as markets have matured, we have seen the institutional share of public equity increasing.[1] Professional managers are continuing to enter the investment management industry, resulting in market research becoming more institutionalized. Hence, more and more industry research analysts are competing against each other and chasing the same set of stocks to generate alpha (or excess returns over the benchmark). This has been one of the factors impeding active fund manager’s ability to exploit information asymmetry to generate alpha. A similar scenario seems to be unfolding in the Indian Equity Large-Cap category, where generating alpha is becoming increasingly difficult for active fund managers, as seen in the SPIVA India Scorecards over the years.
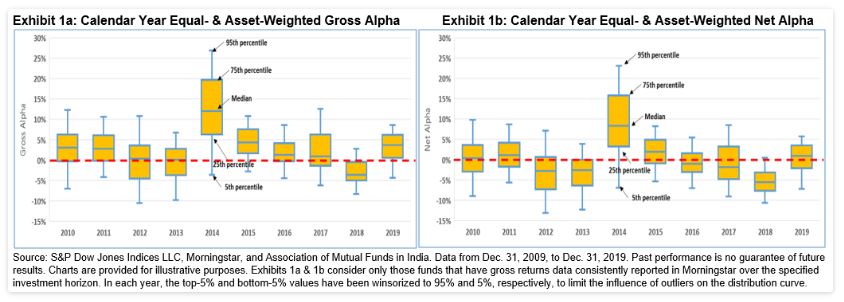
Each box in Exhibits 1a and 1b showcases the spread in alpha[2] generated by Indian Large-Cap Equity active funds in a calendar year. Exhibit 1a calculates alpha based on gross returns minus the S&P BSE 100 (TR) returns (benchmark for large-Cap funds in India), whereas Exhibit 1b is based on excess net-of-fees returns over the benchmark. The exhibits show that there is a wide spread in alpha generated by funds. Exhibit 1a shows that in each calendar year, a fairly large proportion of active fund managers failed to beat the S&P BSE 100 benchmark on a gross-returns basis, i.e., even without deducting management fees. The story looks even more dismal when we look at net alpha (Exhibit 1b), where the median active fund beats the benchmark in only 5 of 10 years.
Each observation in Exhibit 2a shows the distribution of yearly gross alpha for the large-cap category funds for each calendar year from 2010 to 2019,[3] and the gray line is the cumulative distribution curve of all the observations. Exhibit 2b shows the same based on net alpha. According to the gross return distribution in Exhibit 2a, almost 35% of the observations lie to the left of the vertical line that represents the “0% gross alpha.” In other words, 35% of the observations had negative gross returns. When we generate the same chart for net alpha, the distribution curve shifts to the left, with nearly 52% of the observations that lie to the left of the vertical line representing “0% net alpha.” Both charts show that alpha distribution is skewed to the right with a few outlier observations pulling the return alpha average values to the right, while the median values lie to the left of the mean values.
We also conducted a t-test (one-tail) to investigate if the gross alpha and net alpha are significantly greater than 0. Exhibit 3 shows that at a 95% confidence level, gross alpha is significantly greater than 0%. However, the same does not hold true for net alpha. In addition, the mean values exceed the median values for both the gross and net alpha, indicating the gross and net alphas are skewed positively by a few high return funds in the large-cap fund category. These results show the challenges of fishing for outperforming active large-cap funds over the long term.
The short answer to the question in the title of the blog is: quite nearly. With vanishing alpha, it may have long lasting implications for the active management industry where the most skilled managers survive and the funds that lie consistently on the left tail of the curve in Exhibit 2 would face strong challenge to grow or survive for long periods. Based on our SPIVA India Year-End 2019 Scorecard, 68.8% of funds in this category did not survive for the 10-year period ending in December 2019. With the competition that the increasing number of passive investment products brings, active fund managers may find themselves under pressure to generate higher gross alpha over the benchmark or to moderate costs and fees in an attempt to offer enhanced (net) alpha to investors.[4]


[1] https://www.oecd.org/corporate/Owners-of-the-Worlds-Listed-Companies.pdf
[2] Gross alpha = gross returns – benchmark returns; net alpha = net returns – benchmark returns; net returns = gross returns – management fees
[3] Therefore each large-cap fund (that survives and reports during the period from 2010 to 2019) will contribute 10 observations to the histogram. Only funds that survived and reported returns during the entire calendar year were considered for alpha calculations.
[4] This is analysis is inspired from an earlier research carried out by Vanguard for mutual funds domiciled in the U.S. https://personal.vanguard.com/pdf/ISGZSG.pdf
Content Type
Theme
Location
Language