Featured Topics
Featured Products
Events
S&P Global Offerings
Featured Topics
Featured Products
Events
S&P Global Offerings
Featured Topics
Featured Products
Events
S&P Global Offerings
Featured Topics
Featured Products
Events
Language
Featured Products
Ratings & Benchmarks
By Topic
Market Insights
About S&P Global
Corporate Responsibility
Culture & Engagement
Featured Products
Ratings & Benchmarks
By Topic
Market Insights
About S&P Global
Corporate Responsibility
Culture & Engagement
S&P Dow Jones Indices — 2 Sep, 2020
By Karina Tjin
Despite substantial market volatility and significant drawdowns in the first quarter of 2020, the S&P MARC 5% Index ended the quarter in positive territory (see The Importance of Asset Class Diversification: A Performance Analysis of the S&P MARC 5% Index). With markets staging impressive rebounds, we take a renewed look at the performance of the S&P MARC 5% Index on a YTD basis.
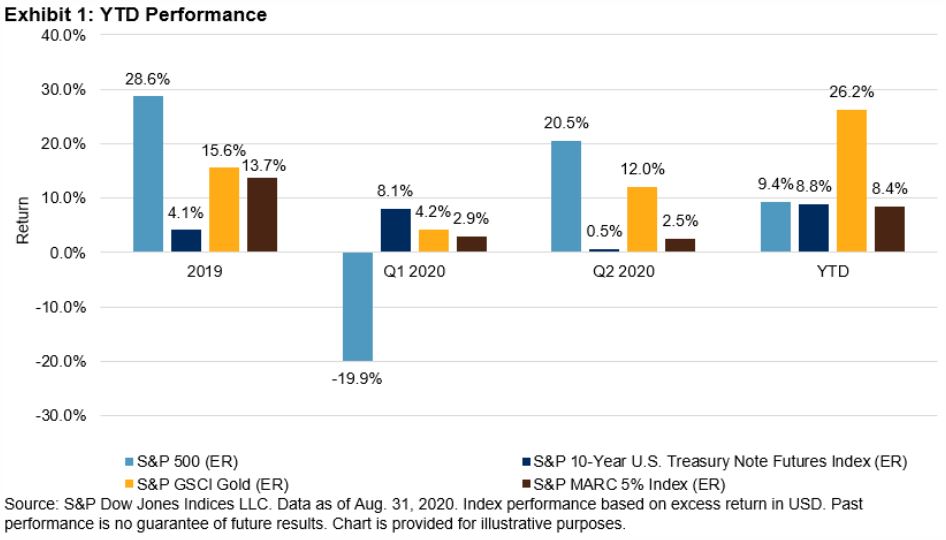
Exhibit 1 shows that the S&P MARC 5% Index had similar returns in Q2 2020 (2.5%) as it did in the first quarter (2.9%). The index returned 8.4% through the end of August 2020.
The underlying components that make up the index are equities, U.S. Treasuries, and gold. Equities (S&P 500®) ended Q1 2020 down 19.9%, but bounced back in Q2 2020 to return 20.5%. Through the end of August 2020, equities returned 9.4%. While the performance of the S&P 10-Year U.S. Treasury Note Futures Index in Q2 2020 dropped compared with that of Q1 2020, it still delivered a YTD return of 8.8%. With more investors turning to gold, the S&P GSCI Gold posted positive returns throughout the year, with an impressive 26.2% return YTD—which is the second-highest annual return (YTD) in the past 10 years.

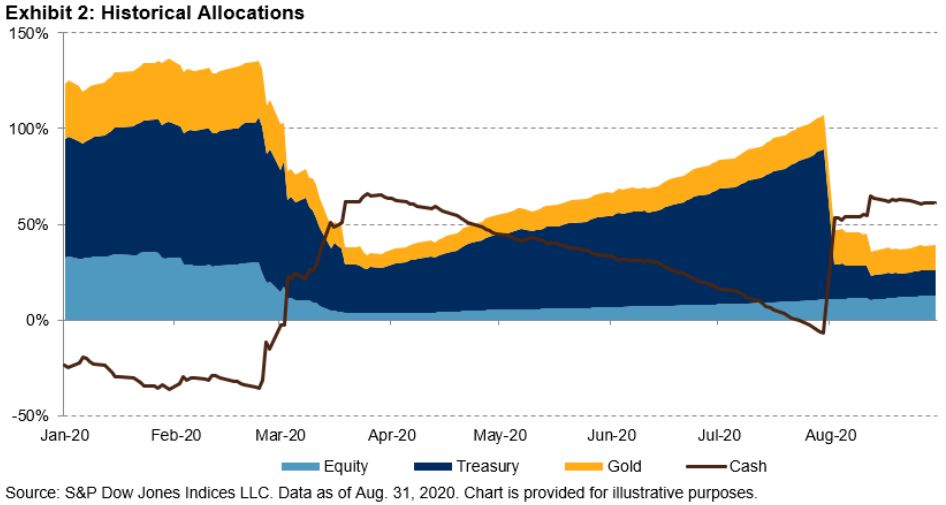
Looking at the underlying asset allocations, the S&P MARC 5% Index allocated over 100% all together to cash, gold, and U.S. Treasuries in Q1 2020 (see Exhibit 2), with an average allocation of 22.5% to equities, 57.6% to U.S. Treasuries, and 23.8% to gold. As volatility picked up in March 2020, the total asset allocation dropped quickly to less than 50% in order to meet the index’s 5% volatility target.
Following March 2020, allocations remained subdued throughout Q2, particularly for the riskiest asset class, equities. On average, the index allocated 6.0% to equities, 42.0% to U.S. Treasuries, and 11.1% to gold in Q2 2020. However, during the last week of July 2020, the index resumed using leverage and allocated over 100%, demonstrating its ability to react quickly to changing market conditions. We note that the index’s recent performance was mainly driven by its allocation to gold and U.S. Treasuries, as its allocation to equities has continued to remain low.

Comparing the S&P MARC 5% Index to the broader market historically, it outperformed the S&P 500 in 14.2% of up-market months and 90.3% of down-market months (see Exhibit 3). In addition, during those down-market months, the index outperformed the S&P 500 on average by 1.3%. The strong performance in down-market months seems to be attributable to the index allowing dynamic allocation shifts in order to maintain the volatility target in times of high volatility.

Content Type
Theme
Location
Segment
Language