


Fifteen years ago, the S&P 500 Low Volatility Index was launched, providing market participants with a transparent, rules-based approach to track the well-documented low volatility anomaly[1]—the tendency for less volatile stocks to deliver superior risk-adjusted performance compared to their higher volatility peers over the long term. By systematically selecting the 100 least volatile stocks from the S&P 500, it offers a disciplined approach to harnessing the anomaly within a large-cap universe.
In the years since its inception, the index has navigated bull markets, multiple economic cycles, major drawdown events and shifting interest rate regimes. As we mark the 15th anniversary of the S&P 500 Low Volatility Index, this paper reviews its performance, characteristics and behavior across this dynamic period. Through 15 exhibits, we analyze how the index has performed, when it has excelled, the challenges it has faced and why it continues to be a distinctive and enduring building block for market participants.
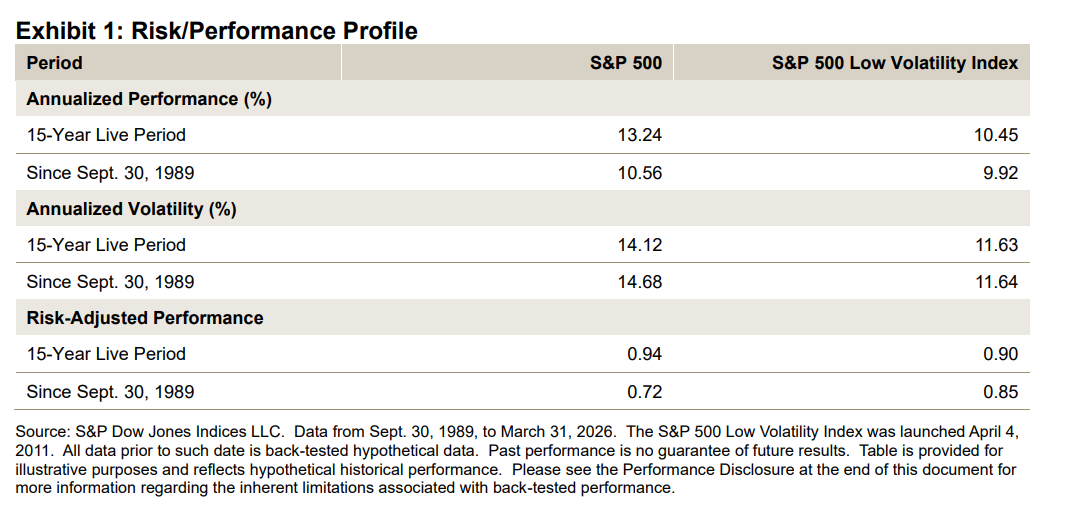
Since the launch of the S&P 500 Low Volatility Index on April 4, 2011, large-cap U.S. equities have performed exceptionally well. The S&P 500 posted an annualized gain of 13.24%, compared to 10.45% for the S&P 500 Low Volatility Index (see Exhibit 1). This performance gap is largely expected: the period has been defined by a historically strong bull market in which growth, high beta and technology stocks have led.
The low volatility anomaly is evident, however, when examining performance over the full period since 1989. While the S&P 500 Low Volatility Index underperformed the S&P 500 by 64 bps (10.56% versus 9.92%) in absolute terms, it outperformed significantly on a risk-adjusted basis, with a ratio of 0.85 compared to 0.72 for the S&P 500.
