Featured Topics
Featured Products
Events
S&P Global Offerings
Featured Topics
Featured Products
Events
S&P Global Offerings
Featured Topics
Featured Products
Events
S&P Global Offerings
Featured Topics
Featured Products
Events
Financial and Market intelligence
Fundamental & Alternative Datasets
Government & Defense
Banking & Capital Markets
Economy & Finance
Energy Transition & Sustainability
Technology & Innovation
Podcasts & Newsletters
Financial and Market intelligence
Fundamental & Alternative Datasets
Government & Defense
Banking & Capital Markets
Economy & Finance
Energy Transition & Sustainability
Technology & Innovation
Podcasts & Newsletters
Research — 9 May, 2022

By Keith Nissen
The lifestyles of Americans are intrinsically linked to their behavior, creating opportunities as well as constraints on digital entertainment-related products and services. For instance, 94% of surveyed Americans own a smartphone, yet 25% do not use the device for online activities. The U.S. online subscription video market is largely saturated, but 29% of those surveyed remain marginal users (1 subscription) or non-users. Twenty-four percent use four or more SVOD services, despite watching only three hours of TV/video per day.

* Based on an analysis of lifestyle characteristics, 48% of Americans are Mainstream Consumers, with another 24% representing affluent young and/or family households (Young and Active/Affluent Family segments), according to Kagan's U.S. Consumer Insights survey completed in March.
* Lifestyles were found to directly correlate with the adoption and overall use of digital entertainment-related products and services.
* Lifestyles can serve as both a predictor of future market development, as well as a constraint of overall market size.

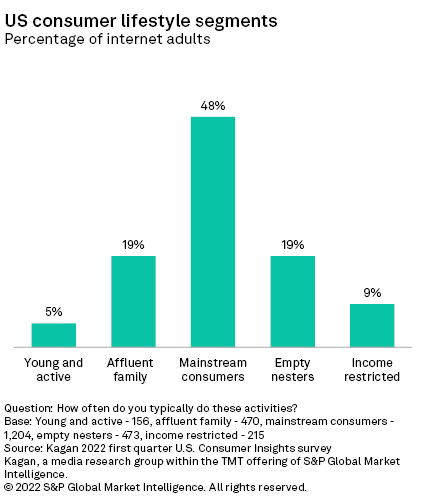
Using data collected from the Kagan first-quarter 2022 U.S. Consumer Insights survey, the frequency of performing seven lifestyle activities, including exercising, reading books and newspapers, playing sports, along with ordering groceries and restaurant food online were factored, generating five distinct consumer segments that closely resemble a bell curve. Approximately half (48%) of internet adults fall into a broad category called Mainstream Consumers. To either side are smaller groups (19% each), titled Affluent Family and Empty nesters. At each of the extremes are the relatively small Young and Active (5%) and Income Restricted (9%) groups.
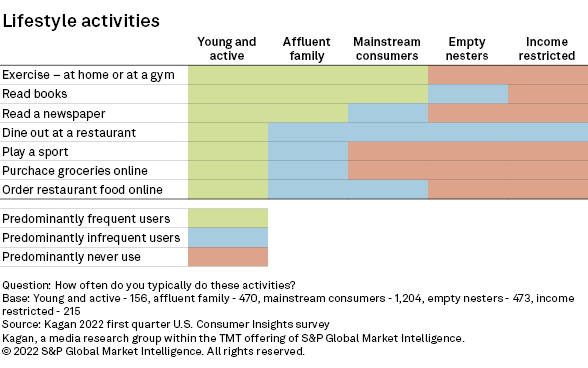
The Young and Active segment is characterized by individuals who typically perform all the lifestyle activities frequently (at least once per week). This group tends to be college-educated men with high income (43% over $100,000 per year); with 68% residing in a multi-adult household with children. The Affluent Family group is also comprised of college-educated high-income family households that tend to exercise and read books/newspapers frequently, but play sports, dine out and order online food infrequently (less than once per week).
The majority of Mainstream Consumers (53%) are college educated but are predominantly households without children (74%). One-third (38%) earn less than $50,000 per year. A large portion of Mainstream Consumers exercise and read books frequently, but the majority do not play sports and never order groceries online.
Empty Nesters are typically non-college-educated adults (63%) with the majority (54%) earning less than $50,000 per year. Eight out of 10 live in households without children. They do not participate in most of the lifestyle activities except for occasionally reading books and going out to dinner. Similarly, the Income Restricted group is made up of low-income adults (65% under $50,000 per year) without a college education; 82% without children. Except for occasionally dining out, they do not participate in any of the lifestyle activities.
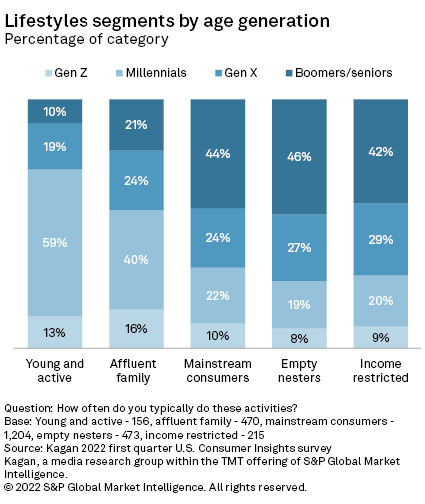
Mainstream Consumers tend to closely mirror the age distribution of the overall internet population with the largest portion (44%) of the group being baby boomers and seniors, ages 57 and above. The Empty Nesters and the Income Restricted groups have age distributions very similar to Mainstream Consumers. Nearly three-quarters (72%) of the Young and Active group and 56% of the Affluent Family group are Gen Z or millennials (ages 18-41).
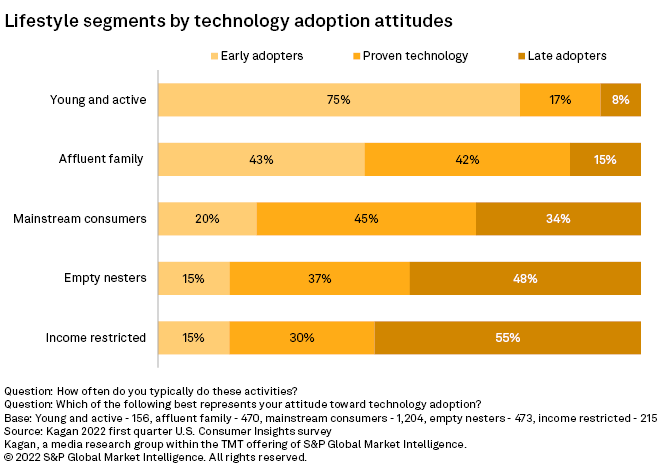
Consumer attitudes toward technology adoption also highlight substantive differences between each of the segments. For instance, three-quarters of the Young and Active group consider themselves to be early adopters, eager to buy the latest high-tech products and services. In contrast, most Mainstream Consumers (45%) prefer to wait until a new technology is proven to work well before adopting. Most Empty Nesters and Income Restricted individuals prefer to be the last to adopt new technology, if at all.
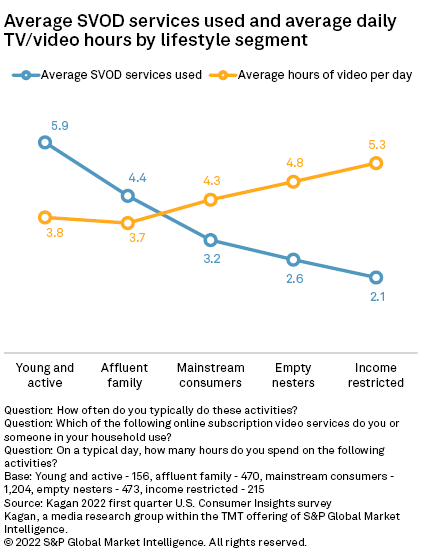
Differences in lifestyle also translate into varying levels of TV/video consumption and services used. For example, individuals in the Young and Active group use an average of approximately six SVOD services but spend the least amount of time (3.8 hours) watching TV/video each day. At the other end of the spectrum, the Income Restricted group typically uses only two SVOD services but watches an average of over five hours of TV/video per day.
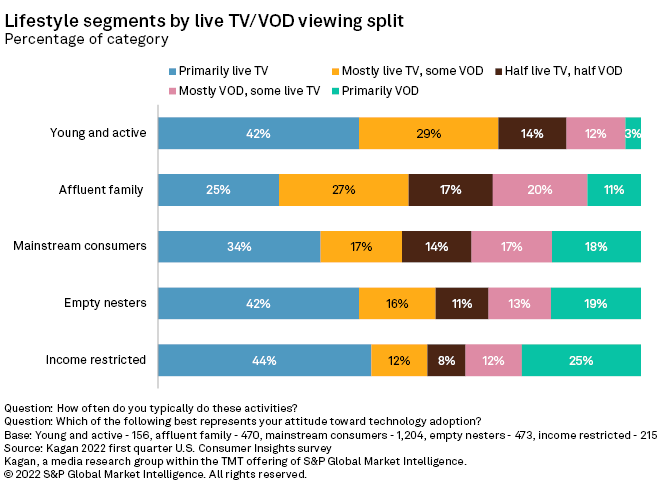
One might expect that individuals who are older, lower income and less tech savvy would tend to watch more live TV than on-demand video. This trend can be seen across the Affluent Family, Mainstream Consumers, Empty Nesters and Income Restricted groups. However, the percentage of those viewing primarily video on demand also increases substantially across the same segments, suggesting that a portion of low-income households could be controlling costs by relying mostly or entirely on online digital entertainment.
The Young and Active group also stands out as an anomaly, being high-income households that use numerous SVOD services, but primarily watch live TV (42%). What differentiates this group from the other segments is that 87% are avid sports fans, which accounts for much of their live TV viewing.
Lifestyles help to explain why mature markets, such as the U.S. digital entertainment market, often plateau out at 65% to 70% usage. Tablet ownership in the U.S. has peaked at 65%, and 61% own a streaming media device. Only 71% of internet adults use more than one free advertising-based online video service, such as YouTube. Lifestyles span a broad range of consumer behaviors that define who we are, how we live, what we buy and how we are entertained. Understanding consumer lifestyles is a key factor in predicting consumer behavior and market evolution.
Data presented in this article was collected from Kagan's Q1'22 U.S. Consumer Insights survey conducted in March 2022. The survey totaled 2,519 internet adults with a margin of error of +/- 1.9 percentage points at the 95% confidence level. Percentages are rounded to the nearest whole number. Gen Z adults are ages 18-24; millennials are 25-41; Gen X is 42-56; and baby boomers/seniors are 57+.
Consumer Insights is a regular feature from Kagan, a group within S&P Global Market Intelligence's TMT offering, providing exclusive research and commentary.
This article was published by S&P Global Market Intelligence and not by S&P Global Ratings, which is a separately managed division of S&P Global.