Featured Topics
Featured Products
Events
S&P Global Offerings
Featured Topics
Featured Products
Events
S&P Global Offerings
Featured Topics
Featured Products
Events
S&P Global Offerings
Featured Topics
Featured Products
Events
Financial and Market intelligence
Fundamental & Alternative Datasets
Government & Defense
Banking & Capital Markets
Economy & Finance
Energy Transition & Sustainability
Technology & Innovation
Podcasts & Newsletters
Financial and Market intelligence
Fundamental & Alternative Datasets
Government & Defense
Banking & Capital Markets
Economy & Finance
Energy Transition & Sustainability
Technology & Innovation
Podcasts & Newsletters
Research — 27 Sep, 2022

By Keith Nissen
Introduction
Results from a Kagan U.S. Consumer Insights surveys shows that the growth in AVOD viewing does not increase overall daily TV/video hours and may be detrimental to the use of SVOD and other forms of on-demand video. The term AVOD comprises all advertising-supported video including both streamed video channels and on-demand video.

* U.S. Consumer Insights online survey data shows that increased AVOD viewing has a detrimental impact on the use of VOD in other forms, including SVOD.
* Just over half of U.S. internet adults report watching some form of AVOD content.
* Increased AVOD viewing or increased VOD viewing hours, in general, does not increase overall daily TV/video viewing hours.

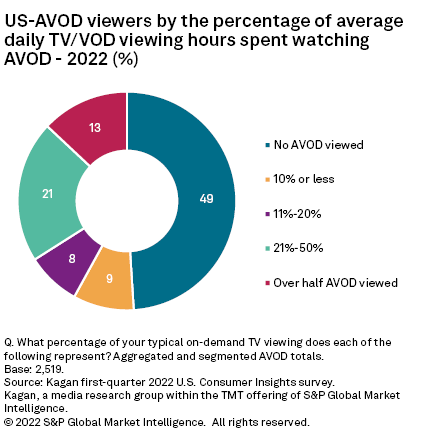
Results from the Kagan first-quarter 2022 U.S. Consumer Insights survey reveal that approximately half of Americans personally watch free online advertising-supported video on demand, or AVOD, services. This is substantially lower than the 72% of internet households that report using AVOD services, overall. The survey also found that AVOD viewing levels vary, with 9% spending 10% or less of their daily VOD viewing hours watching AVOD, compared to 8% spending 11%-20% and 21% spending 21%-50% of their daily VOD hours watching AVOD content. Only 13% of survey respondents indicated that over half of their VOD viewing hours are spent watching AVOD.
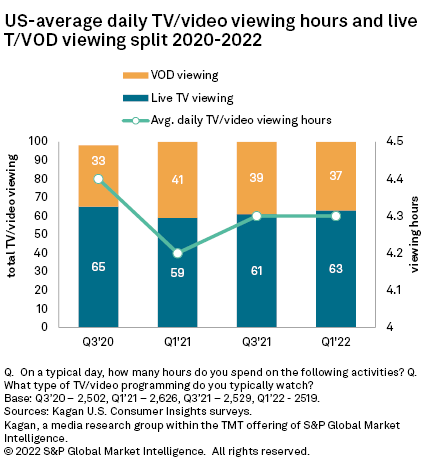
To put this into context, historical survey data shows two significant trends. First, despite the widescale adoption of online video services in the U.S. and a perceived shift to viewing more on-demand video, the surveys illustrate that approximately 60% of consumer TV/video viewing hours are still spent watching live TV. Secondly, the survey data reveals a strong correlation between daily viewing hours and VOD consumption. For example, TV/VOD viewing hours declined slightly in early 2021 from 4.4 to 4.2 hours per day on average but have, as of the spring of 2022, rebounded to more traditional levels (4.3 hours per day). It is interesting that this decline and rebound in viewing hours over the past two years corresponds to an increase in VOD viewing in early 2021 (35% to 41%) followed by a gradual receding of VOD viewing back toward the historical norm.
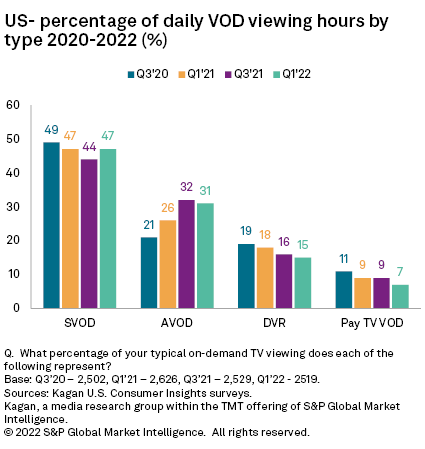
Historical survey data also confirms that approximately half of daily VOD viewing hours are spent watching subscription video, or SVOD. The data shows a 5 percentage-point decline (49% to 44%) in SVOD viewing hours from the fall of 2020 to the fall of 2021, followed by a 3 percentage-point increase (47%) in SVOD hours in early 2022. This decline in SVOD viewing corresponds to an 11 percentage-point rise (21% to 32%) in AVOD viewing hours through fall 2021, with a slight decline in early 2022. Hours spent watching DVR recorded content and pay TV operator VOD content has steadily declined over the past two years. The correlation between the dip in SVOD viewing, the decline in DVR and Pay TV VOD viewing in association with the rise in AVOD viewing suggests that future growth in AVOD viewing will continue to impact other forms of VOD.
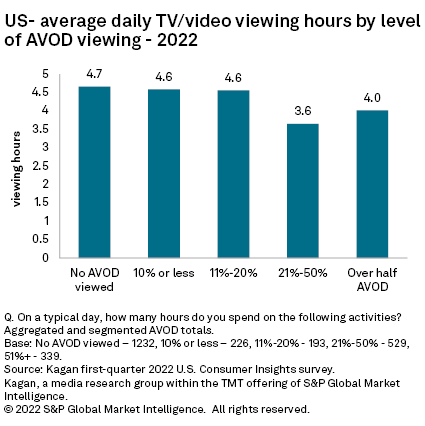
Another takeaway from the 2022 survey is that increased AVOD viewing does not necessarily expand overall daily TV/video viewing hours. For instance, those who spend 20% or less of their VOD viewing time on AVOD watch an average of 4.6 hours of TV/video per day, comparable to that of individuals who do not watch AVOD content at all. However, the survey data shows that those who spend over 20% of their daily VOD hours on AVOD watch substantially less (3.6 hours) TV/video per day consuming video. As the volume of AVOD viewing increases further, daily video consumption increases, but is still substantially below those who spend much less time watching AVOD content.
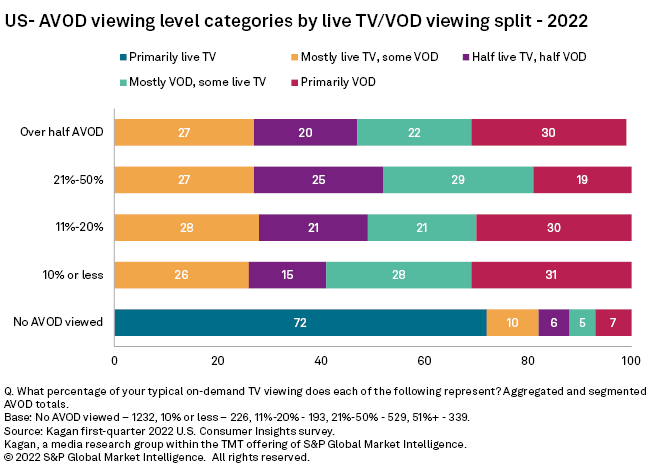
It is also significant that among those not viewing any AVOD, approximately seven in 10 watch minimal VOD content overall (i.e. they watch primarily live TV) and 82% watch primarily or mostly live TV. In contrast, those who watch AVOD tend to be split fairly evenly between those watching mostly live TV and those watching mostly or primarily VOD content.
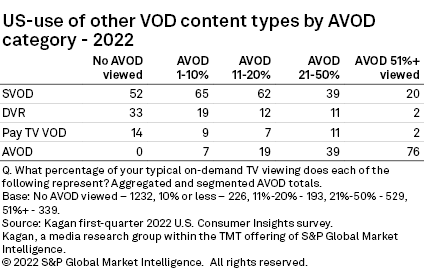
Finally, we look at how AVOD viewers and non-AVOD viewers are spending the rest of their daily VOD viewing hours. The survey shows that for those who do not view any AVOD content (of which only 28% watch VOD content), the majority (52%) of their VOD hours are spent on SVOD, followed by DVR-recorded content (33%). Among those that spend only a little time (1%-10% of VOD hours) each day watching AVOD, two-thirds of their VOD hours (65%) is spent watching SVOD content, but AVOD has cut into their viewing of DVR-recorded programs and the use of pay TV operator VOD services. Among those in the 11%-20% AVOD segment, time spent on pay TV operator VOD and DVR-recorded content continues to decline, while it appears that the increased AVOD (19%) viewing has little impact on SVOD viewing hours (62%). As AVOD viewing further expands (21%-50%), there is a dramatic decline in hours spent on SVOD content (39%). The survey found that those who spend the majority of their VOD hours watching AVOD actually spend 76% on AVOD with still fewer hours watching SVOD and the viewing of DVR and pay TV VOD content is almost eliminated.
The Kagan U.S. Consumer Insights surveys were conducted from the first quarter of 2018 to the first quarter of 2022, with approximately 2,500 internet adults per survey wave. Each survey has a margin of error of +/-1.9 ppts at the 95% confidence level. Percentages are rounded to the nearest whole number. Survey data should only be used to identify general market characteristics and directional trends.
Consumer Insights is a regular feature from Kagan, a group within S&P Global Market Intelligence's TMT offering, providing exclusive research and commentary.
This article was published by S&P Global Market Intelligence and not by S&P Global Ratings, which is a separately managed division of S&P Global.