


28 Jul, 2020
The Analyst Matrix: Profiting from Sell-Side Analysts’ Coverage Networks
Highlights
This report uses sell-side analysts’ coverage data to build a network of connected firms. This network has three broad applications: quantifying economic linkages between companies; forecasting fundamentals of companies in the network; and as a stock selection signal.
Stock selection signals constructed from the network deliver positive long-only and long-short returns globally, while models used to forecast company earnings revisions can be improved by incorporating information from the network.
Asset prices update much slower for companies with many connections (compared to those with a few connections) as investors need more time to process all related-firm news in the network.
Sell-side analyst coverage data provides a new and rich source of establishing connections between firms, as analysts (given their industry expertise) are likely to cover fundamentally related firms. This report uses sell-side analysts’ coverage data to build a connected-firm network (CFN) - a portfolio of companies that are covered by analyst(s) that follow a focal firm. This network has three broad applications: measuring the “strength” of economic relationships between companies; forecasting fundamentals of companies in the network; and as a stock selection signal. Key insights include:
• Connected-firm networks quantify the strength of relationships between companies in the network (Figure 1), unlike sector relationships which are binary.
• The alpha signal constructed from the network is effective across most developed markets, with long-short returns ranging from 4.08% (Europe ex-UK) to 7.78% (US). Performance is also stronger within a universe of firms with the most complex networks (9.69%), vs. 6.02% for a universe of stocks with simple networks.
• Models used to forecast EPS estimate revisions can be improved by incorporating the prior month’s estimate revisions for all the stocks in the company’s connected-firm network.
Figure 1 describes the process of building a network using analyst coverage data for six stocks, collectively named FAANGM - Facebook (FB), Apple (AAPL), Amazon (AMZN), Netflix (NFLX), Alphabet (GOOG) and Microsoft (MSFT).
Figure 1: Analyst-Network for FAANGM Stocks as of 12/31/2019
Width of Edges Signify the Number of Analysts that Co-Cover Two Stocks
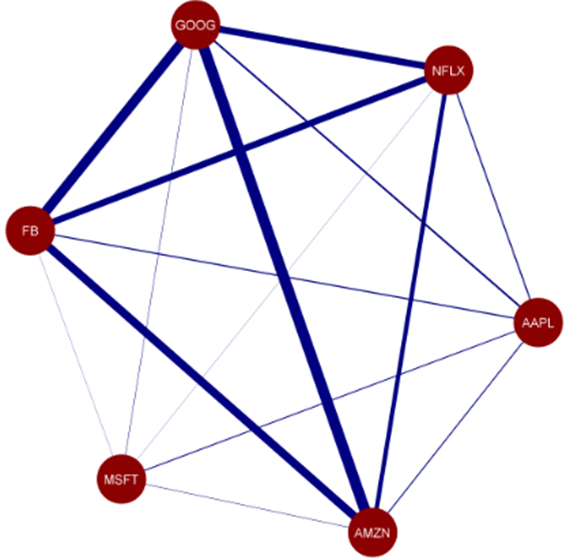
Source: S&P Global Market Intelligence Quantamental Research. Data as of 02/28/2020.
Products & Offerings
Segment