Featured Topics
Featured Products
Events
S&P Global Offerings
Featured Topics
Featured Products
Events
S&P Global Offerings
Featured Topics
Featured Products
Events
S&P Global Offerings
Featured Topics
Featured Products
Events
Financial and Market intelligence
Fundamental & Alternative Datasets
Government & Defense
Banking & Capital Markets
Economy & Finance
Energy Transition & Sustainability
Technology & Innovation
Podcasts & Newsletters
Financial and Market intelligence
Fundamental & Alternative Datasets
Government & Defense
Banking & Capital Markets
Economy & Finance
Energy Transition & Sustainability
Technology & Innovation
Podcasts & Newsletters
27 Jun, 2016 | 11:00
Highlights
In this month’s Risk Insight blog, Eduardo Alves introduces our PD Market Signals Model and uses it to analyze the credit risk of 7 Oil & Gas companies.
Staying on top of credit risk requires a robust risk assessment framework at origination coupled with a dynamic risk monitoring tool. Current volatility in the Oil and Gas industry makes it an ideal case study to demonstrate the value of these solutions working together.
This month’s installment of the Risk Insight Video & Blog Series will focus on two topics:
Watch Eduardo Alves’s video to explore this topic:
Topic 1: PD Market Signals Model (PDMS)
The PD Market Signals Model is an analytical tool offered by S&P Global Market Intelligence that produces a probability of default over a 1- to 5-year horizon for all public corporates and financial institutions globally. Among the enhancements to the traditional equity–based “structural framework”, this model explicitly incorporates Country and Industry Risk dimensions.#captionRightLarge("Since the beginning of 2016, 42 Oil and Gas companies declared bankruptcy.")I already discussed the importance of Industry Risk in the analysis of counterparties in a previous issue of this series, entitled“What’s Driving the Oil and Gas Industry Credit Slide?”. At that time, I concluded that the current Oil and Gas industry environment combines a steeper-than-average cyclical downturn with a permanent shift in industry dynamics.
Topic 2: PDMS for 7 Defaulted, Rated Oil and Gas Entities
Since the beginning of 2016, 42 Oil and Gas companies declared bankruptcy, according to data from the S&P Capital IQ platform. Of these, 7 had a public rating from S&P Global Ratings of “CCC” or above as of 6 months ago.
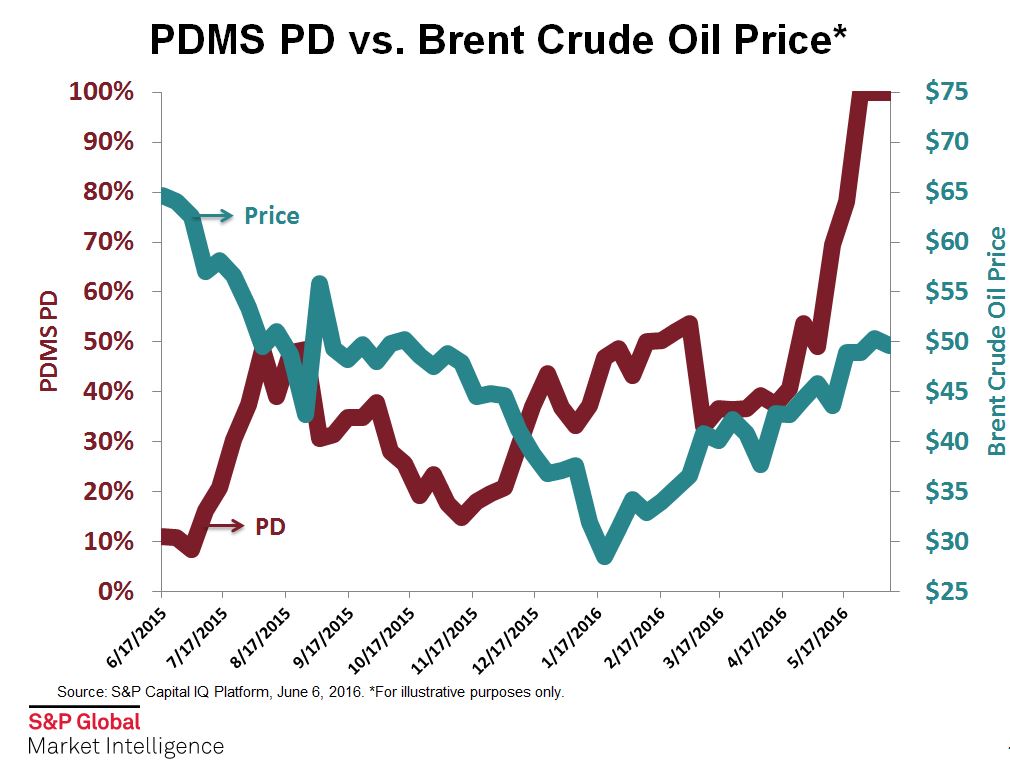
To see the “slippery slope” or, more specifically, the path to default of these 7 companies, I plotted their average market-implied probability of default given by the PD Market Signals model against the price of oil for the last 12 months.
The date is on the horizontal-axis. Average probability of default is on the left-hand axis, plotted in Red. Price of oil is on the right-hand axis, plotted in Teal.
Watch Eduardo Alves’s video to explore this topic.
A Single Solution For Your Credit Analysis Needs:
Credit Analytics on the S&P Capital IQ platform addresses the time, data integrity, and information gaps encountered when analyzing and monitoring the creditworthiness of counterparties and investments. Request a demo of Credit Analytics to learn how you can overcome challenges when dealing with unrated, public and private companies, a myriad of counterparties, and inconsistent data.
We hope you enjoyed the June 2016 installment of the Risk Insight Monthly Video & Blog Series. Check back here each month to read the latest Risk Insight blog and watch the video.


