


Research — Dec 9, 2024
Content most enjoyed on top US SVOD services, (US) 2024

By Brian Bacon
Original TV programs have returned to the mean, and live sports are making a play on streaming services. According to data from S&P Global Market Intelligence Kagan’s US Consumer Insights surveys, conducted in the third quarter of each year from 2017 to 2024, the share of users of the top subscription video on-demand services selecting original TV programs as the content they most enjoy on the service significantly increased in 2023, only to decrease back to the norm in 2024. Live sports was also added as a category in the 2024 survey and was chosen as the content most enjoyed on at least one of these services by 15% of total respondents.
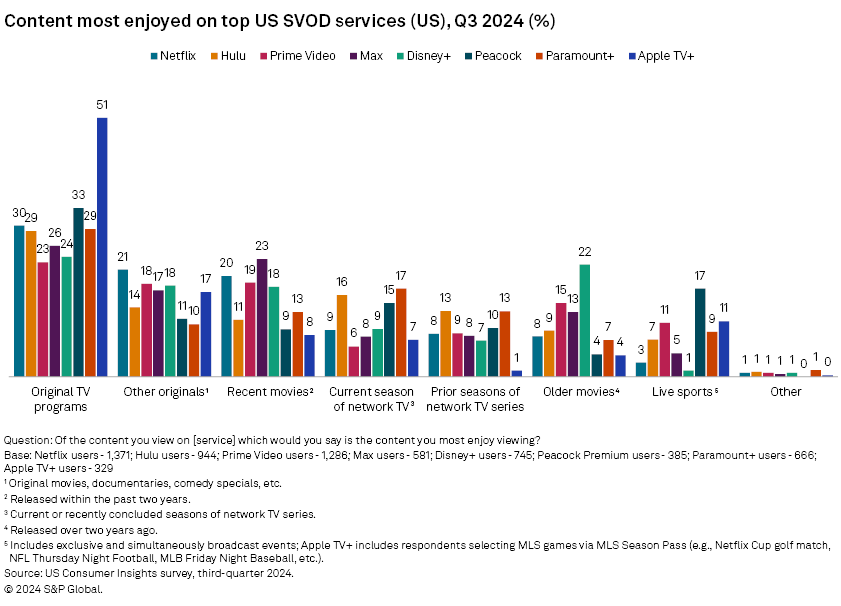
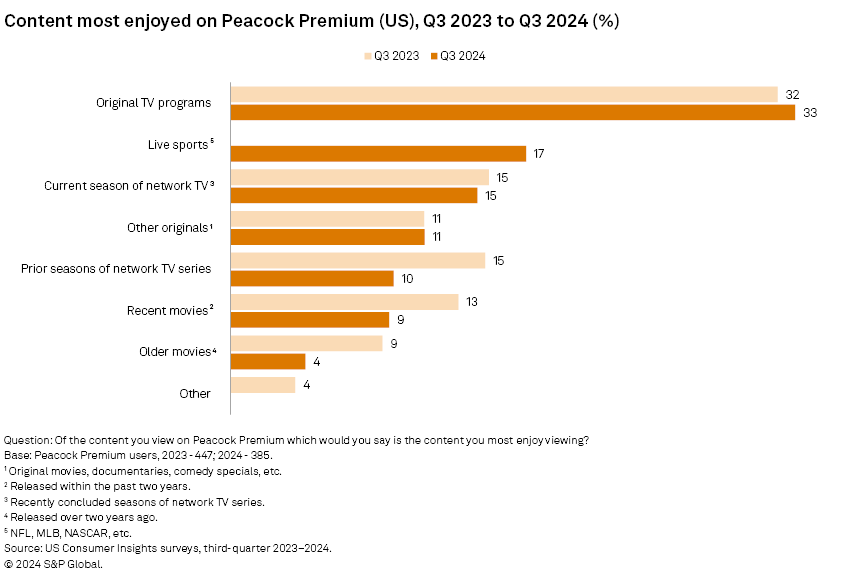
Among the services surveyed, Comcast Corp.'s Peacock users were the most likely to select live sports as the category of content they most enjoyed on the service at 17%, followed by Amazon.com Inc.'s Prime Video and Apple Inc.'s Apple TV+ users, both at 11%. Peacock and Prime Video have exclusive NFL games, which most likely drives the larger share of users selecting live sports as the content they most enjoy on these services. Paramount Global's Paramount+ also streams NFL games, but only 9% selected live sports as the content they most enjoy on the service, most likely because the games are also broadcast on CBS (US).

➤ Data from Kagan's 2024 US Consumer Insights survey shows that the share of users selecting original TV programs as the content they most enjoy on top streaming services dropped compared to 2023 results, except for Peacock.
➤ Among Netflix users, the share selecting recent movies and other originals (movies, comedy specials, etc.) increased the most compared to 2023 results.
➤ The addition of live sports shifted the rates of content most enjoyed on Prime Video away from original TV programs compared to 2023 results, while the rest of the content types held at about the same rates.
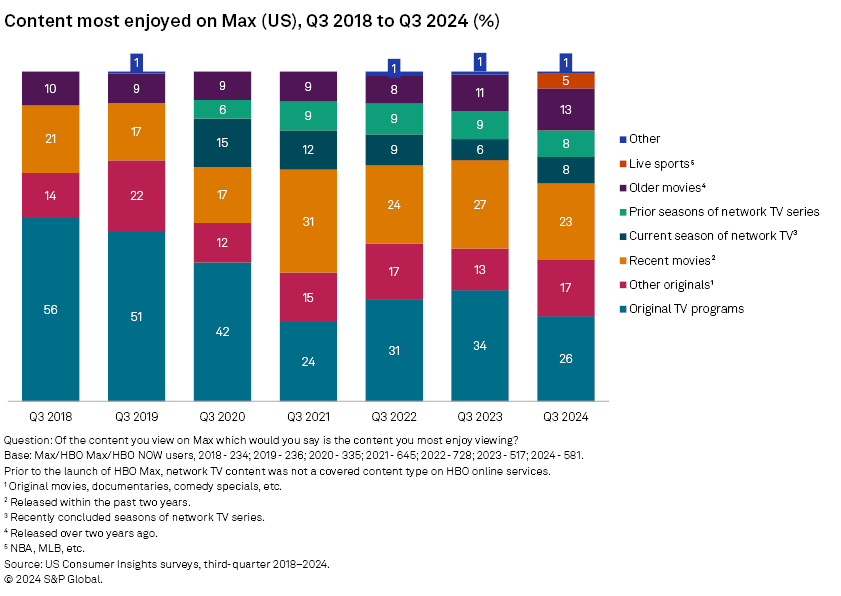
➤ Since 2022, the share of Max users selecting older movies has increased from 8% to 13%.

For full tables in Excel format, click here.
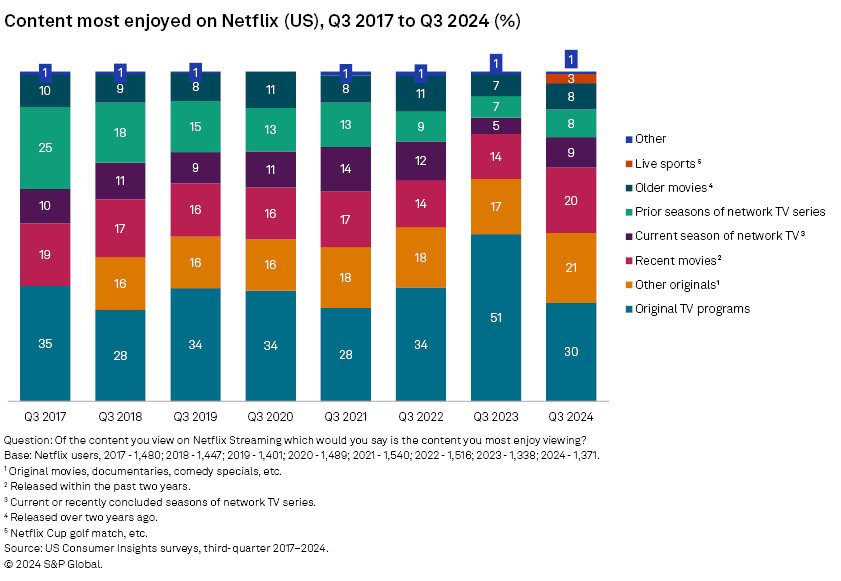
Among Netflix Inc. users, there was a significant drop in the share selecting original TV programs as the content they most enjoy on the service, declining from 51% in 2023 to 30% in 2024. The large share selecting original TV programs in 2023 appears to have been an anomaly, as about a third of users indicated they most enjoy original TV programs on the service in all other waves of the survey. Further, the drop in users selecting original TV programs in 2024 wasn't due to the addition of live sports as a content type, with only 3% of users surveyed selecting sports as content most enjoyed on the service. Recent movies and other originals gained the most share from 2023 to 2024, at 14% to 20% and 17% to 21%, respectively.
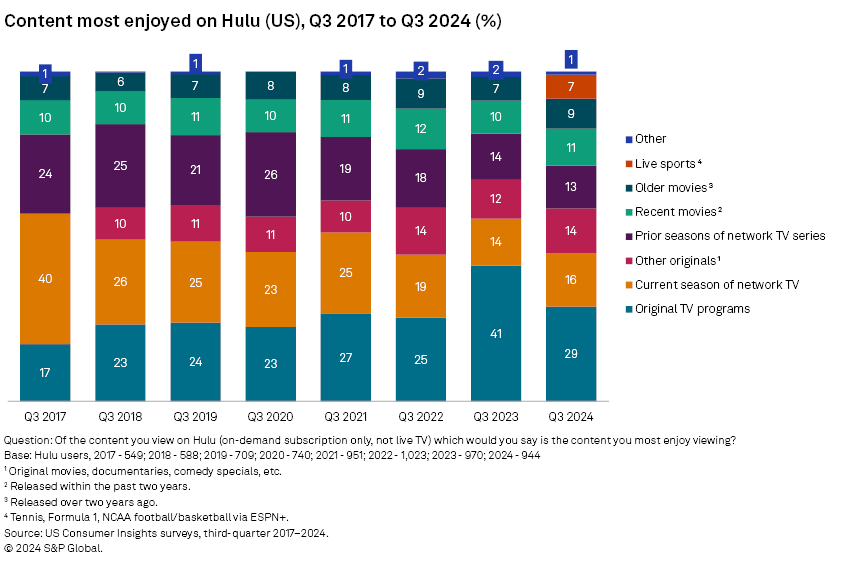
Similar to the trend among Netflix users, the share of Walt Disney Co.'s Hulu users selecting original TV programs as the most enjoyed content on Hulu was up from 25% in 2022 to 41% in 2023, only to drop to 29% in 2024. Live sports was the most enjoyed content for 7% of users surveyed, although some users could be referring to live sports through ESPN+ as part of the Disney streaming bundle of Disney+, Hulu and ESPN+.
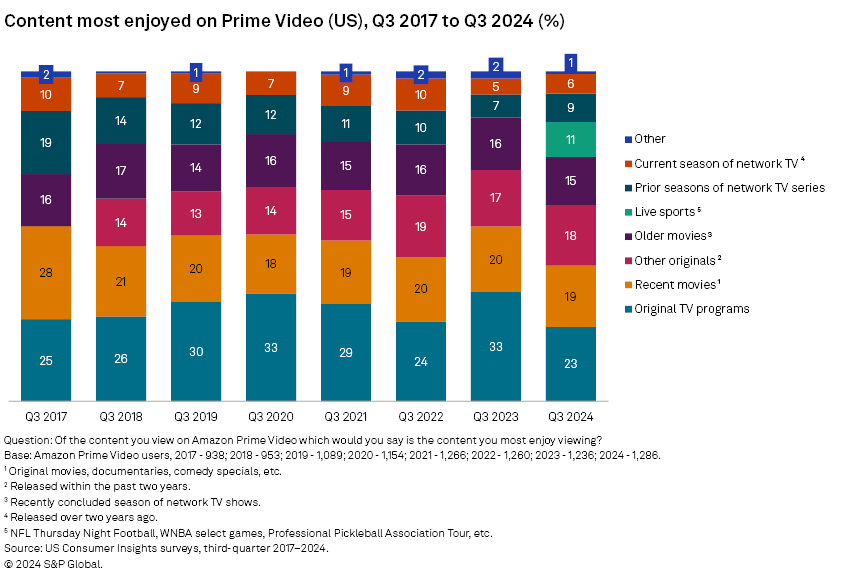
Among Prime Video users, 11% selected live sports for content most enjoyed, likely driven by NFL Thursday Night Football although Prime Video users in the US can also access MLB, WNBA and other live sports. The shares selecting the other content types remained about the same, except for those who most enjoyed original TV programs, which dropped from 33% in 2023 to 23% in 2024.
Again, original TV programs was selected by a smaller share of Warner Bros. Discovery Inc.'s Max users at 26%, compared to 34% in the 2023 survey. Only 5% of users selected live sports as the content they most enjoyed on Max; however, the survey was fielded prior to several MLB playoff games which were exclusive to the service. The share selecting older movies, released more than two years ago, increased from 8% in 2022 to 13% in 2024.
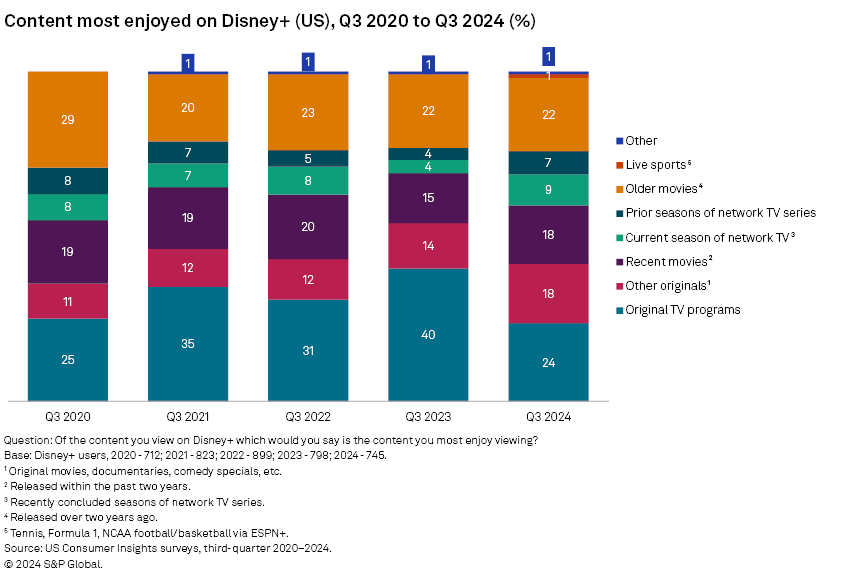
The share of Disney+ users selecting original TV programs as the content they most enjoy on the service took a significant hit, declining from 40% in 2023 to 24% in 2024. No single content type compensated for the drop in share selecting original TV programs. Only 1% of users selected live sports, most likely impacted by sports content coming via ESPN+.
The exclusive NFL games on Peacock has likely had a big impact on the content most enjoyed on the service, with 17% of users selecting live sports. Other live sports available to Peacock users include NCAA football, WWE wrestling, Premier League soccer and NASCAR racing. However, original TV programs was still selected by 33%, about twice the share of those who selected live sports. In fact, Peacock was the only service surveyed where the share of users selecting original TV programs as the content most enjoyed increased compared to 2023 results.
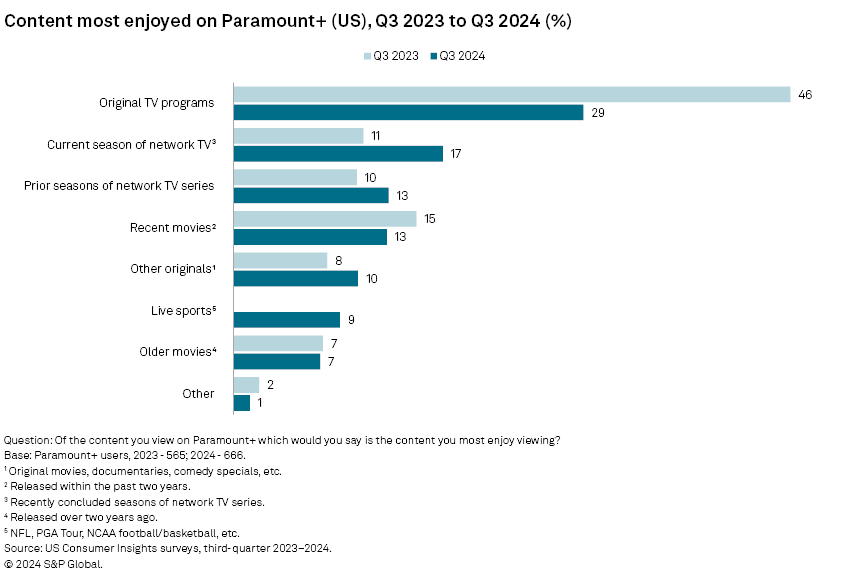
Paramount+ was another service with a significant drop in the share of users selecting original TV programs as the content they most enjoyed on the service, falling from 46% in 2023 to 29% in 2024. Users were more likely to select current and prior seasons of network TV shows compared to 2023 results. The share selecting other originals also increased slightly from 8% to 10%. Similar to Peacock, live sports are an important part of the Paramount+ content offering, with 9% of users selecting it as the content they most enjoy on the service.
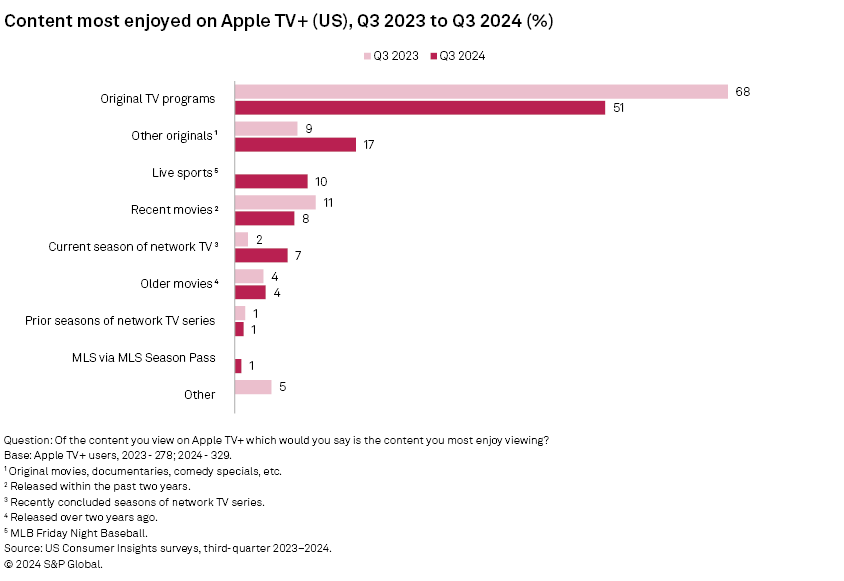
Among Apple TV+ subscribers surveyed, the share selecting original TV programs dropped from 68% in 2023 to 51% in 2024. The addition of live sports as a category was a major factor, with 10% selecting it as the content they most enjoy on the service, another 1% selected MLS via MLS Season Pass which is a separate subscription. Other noteworthy shifts include the share selecting other originals increasing from 9% to 17% and current season of network TV increasing from 2% to 7%.
This article was published by S&P Global Market Intelligence and not by S&P Global Ratings, which is a separately managed division of S&P Global.
Consumer Insights is a regular feature from S&P Market Intelligence Kagan.
Wireless Investor is a regular feature from S&P Global Market Intelligence Kagan.
Data presented in this article is from Kagan's US Consumer Insights surveys conducted in the third quarters of 2017 through 2024. The online surveys included 2,526 (2017), 2,536 (2018), 2,531 (2019), 2,502 (2020), 2,529 (2021), 2,528 (2022), 2,500 (2023) and 2,500 (2024) US internet adults matched by age and gender to the US Census. The survey results have a margin of error of +/-1.9 ppts at the 95% confidence level. Survey data should only be used to identify general market characteristics and directional trends.