Featured Topics
Featured Products
Events
S&P Global Offerings
Featured Topics
Featured Products
Events
S&P Global Offerings
Featured Topics
Featured Products
Events
S&P Global Offerings
Featured Topics
Featured Products
Events
Financial and Market intelligence
Fundamental & Alternative Datasets
Government & Defense
Banking & Capital Markets
Economy & Finance
Energy Transition & Sustainability
Technology & Innovation
Podcasts & Newsletters
Financial and Market intelligence
Fundamental & Alternative Datasets
Government & Defense
Banking & Capital Markets
Economy & Finance
Energy Transition & Sustainability
Technology & Innovation
Podcasts & Newsletters
Research — 25 Nov, 2022

By Brian Bacon
Introduction
Hulu users, including paid subscribers and unpaid users, are less likely to turn to the service for viewing network TV shows than they were in previous years, according to data from Kagan's U.S. online Consumer Insights surveys.
Results show that the decline of users indicating they most enjoy prior seasons of network TV series on Walt Disney Co.'s Hulu, which fell from 26% in 2020 to 19% in 2021, was not a fluke, as that number dipped further to only 18% in 2022. Users indicating that they most enjoyed current seasons of network TV were also down from 25% in 2021 to 19% in 2022. This decline is most likely due to the availability of this content on other services such as Paramount Global's Paramount+ and Comcast Corp.'s Peacock. The largest share of Hulu users chose original TV programs as the content they most enjoyed at 25%, while other originals rose from 10% in 2021 to 14% in 2022.

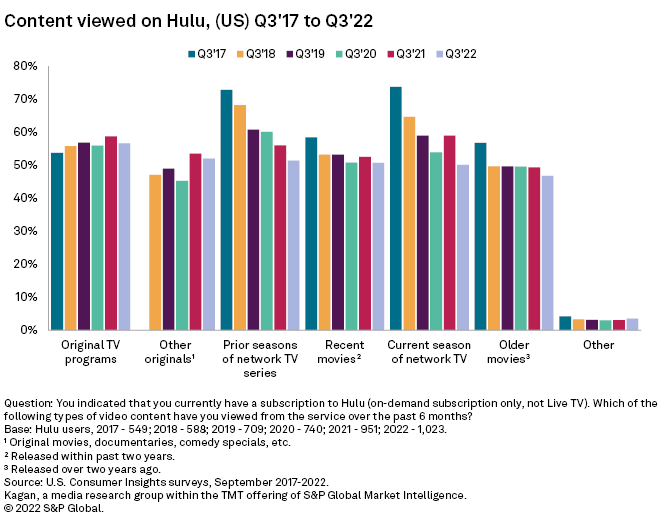
* Kagan's U.S. Consumer Insights survey showed that current season network TV, which used to be the most widely viewed content type on the service, is down with the rest of the content types at 50% of Hulu users.
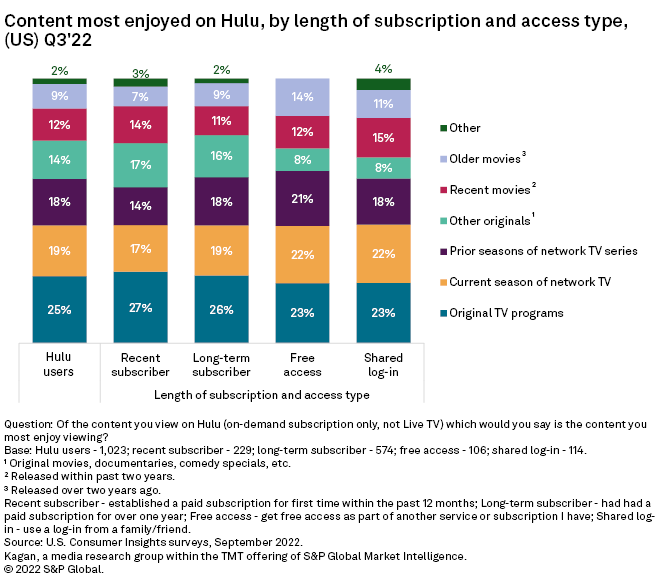
* The decline in those who most enjoy current season network TV series was among both recent and long-term subscribers of the service.
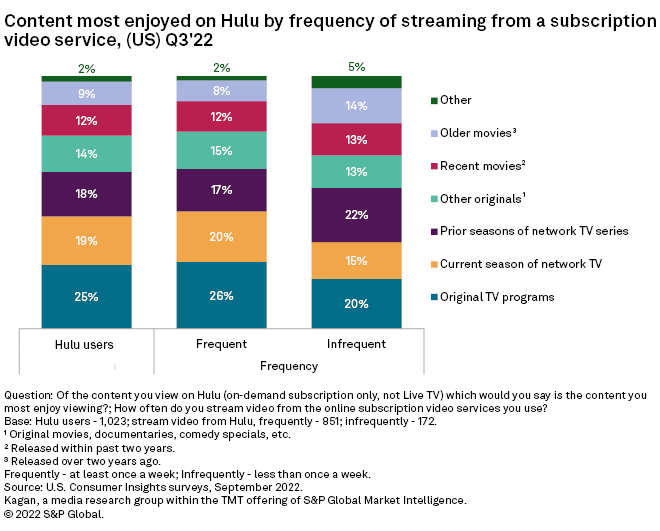
* Frequent Hulu streamers (at least once per week) were more likely to most enjoy original TV programs and current seasons of network TV series compared to infrequent streamers.

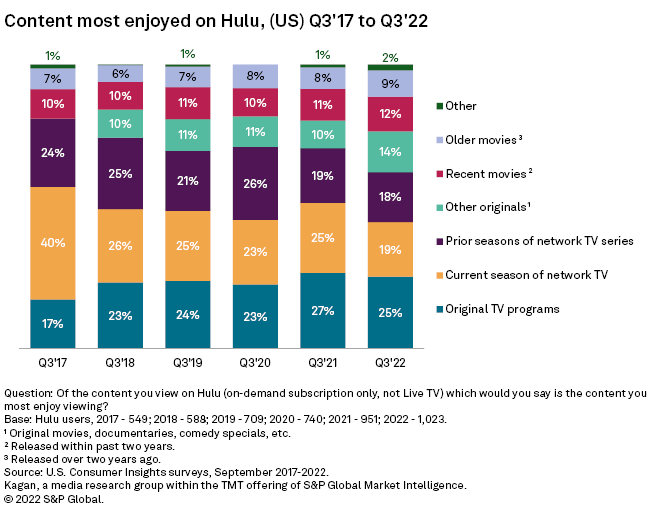
In terms of viewing these content types, most have remained flat over the years while current and prior seasons of network TV series have both undergone steady declines. Although current season TV rose back up to 59% in 2021, viewership of this content dropped down to 50% in 2022, bringing it in line with prior seasons of network TV and recent movies, both at 51%.
Original TV programs and other originals were the most enjoyed content for larger shares of recent (within the past year) and long-term (over a year) subscribers compared to free access (received as part of another subscription) and shared log-in (used a log-in from a family/friend) users. Free access users were the most likely to indicate they most enjoy prior seasons of network TV at 21%, and older movies at 14%, compared to other users. Free access and shared log-in users were a little more likely to most enjoy the current season of network TV series, both at 22%, compared to recent and long-term subs at 17% and 19%, respectively.
Infrequent users were more likely to most enjoy prior seasons of network TV series at 22% and older movies at 14% compared to frequent users at 17% and 8%, respectively. Conversely, frequent users chose original TV programs at 26% and the current season on network TV at 20% as content most enjoyed, compared to infrequent users at 20% and 15%, respectively.
Original TV programs was the most enjoyed content by an increasingly larger share among older users, from 20% among Gen Z to 31% among boomers/seniors. The largest share of those who most enjoy the current season of network TV was among millennials at 21%, along with other originals at 17%. Gen Z had the largest share indicating they most enjoy recent movies at 16% and older movies at 12%.
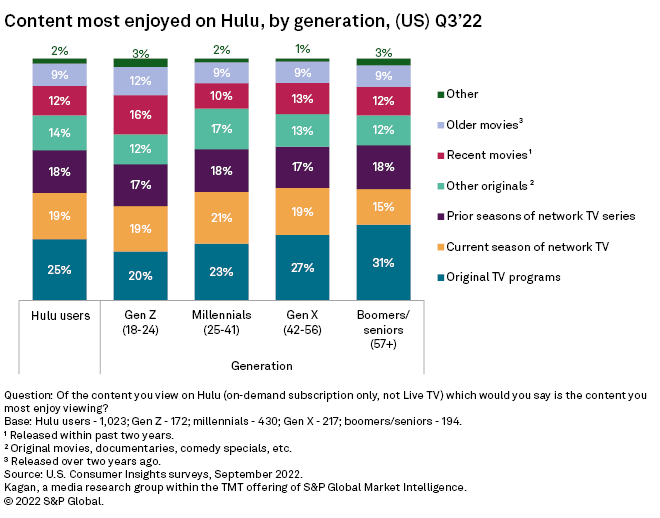
Data presented in this article is from Kagan's U.S. Consumer Insights surveys conducted in September 2017-2022. The online survey included 2,526 (2017), 2,536 (2018), 2,531 (2019), 2,502 (2020), 2,529 (2021) and 2,528 (2022) U.S. internet adults matched by age and gender to the U.S. Census. The survey results have a margin of error of +/-1.9 percentage points at the 95% confidence level. Percentages are rounded to the nearest whole number. Gen Z adults are ages 18-24; millennials are 25-41; Gen Xers are 42-56; and baby boomers/seniors are 57 and older.
To submit direct feedback/suggestions on the questions presented here, please use the "feedback" button located above, directly under the title of this article. Note that while all submissions will be reviewed and every attempt will be made to provide pertinent data, Kagan is unable to guarantee inclusion of specific questions in future surveys.
For more information about the terms of access to the raw data underlying this survey, please contact support.mi@spglobal.com.
Consumer Insights is a regular feature from Kagan, a media research group within S&P Global Market Intelligence's TMT offering, providing exclusive research and commentary.
This article was published by S&P Global Market Intelligence and not by S&P Global Ratings, which is a separately managed division of S&P Global.