


Research — Feb 27, 2025
Above-average solar radiation, below-average winds in the US in January

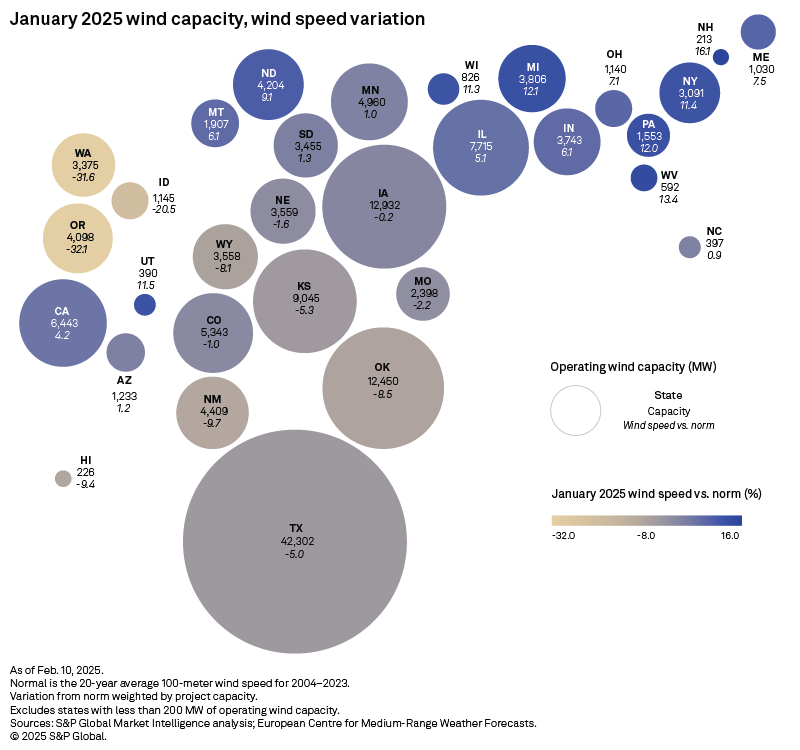
The 127.2 GW of operating solar capacity in the US experienced solar radiation 9.4% above normal in January, while the 152.5 GW of wind capacity experienced wind speeds that were down 2.7%.
Download data details in Excel.
Wind
Wind speeds were furthest below normal in Oregon and Washington, with both reporting more than 30% reductions. The Northeast had positive wind speed deviations, with the highest being 16.1% in New Hampshire's 213 MW of capacity.
The three states with the highest wind capacity all had below-average wind speeds. The deviations were negative 5.0% for Texas's 42.3 GW, negative 0.2% for Iowa's 12.9 GW, and negative 8.5% for Oklahoma's 12.4 GW.
The largest positive wind speed deviation was recorded at the 24.6-MW Eva Creek Wind Project in Alaska, with wind speeds 75.6% above normal. In contrast, four projects in Oregon — Schumann Wind Farm, Vansycle II Wind Energy Center, Chopin Wind Farm and Eurus Combine Hills II Wind Project — had wind speeds that were 50.2% below normal. Together, these projects total 190.1 MW.
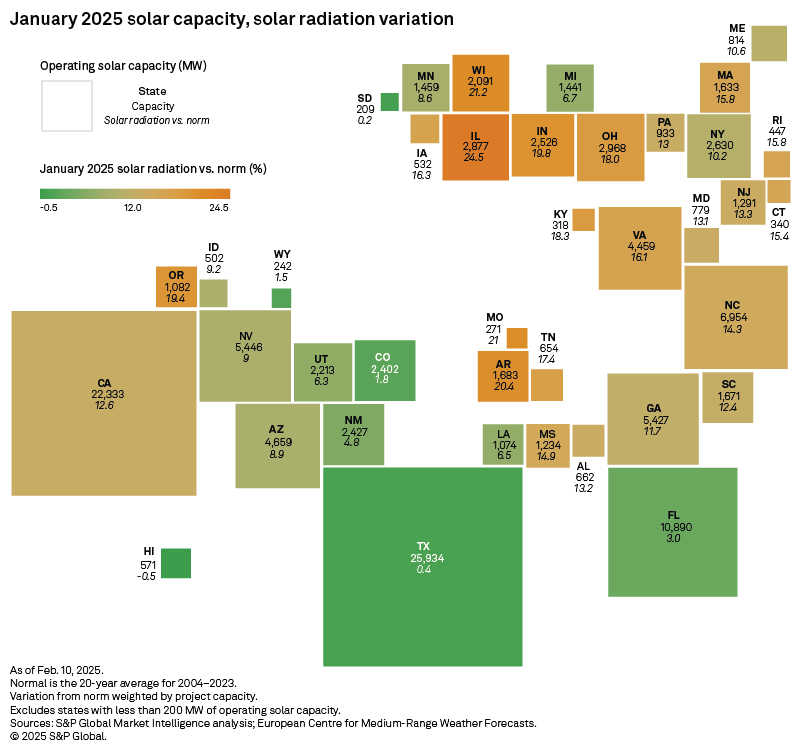
Solar
The three states with the highest solar capacity all experienced above-average solar radiation. The deviations were 0.4% for Texas' 25.9 GW, a notable 12.6% for California's 22.3 GW, and 3.0% for Florida's 10.9 GW. States with 18% and higher solar radiation deviations included (in descending order) Illinois, Wisconsin, Missouri, Arkansas, Indiana, Oregon, Kentucky and Ohio — most of the states in the Midwest.
Significant solar deviations were observed in the country's three largest solar projects. The 690-MW Gemini Solar Project in Nevada was 8.8% above normal. Texas' Danish Fields Solar Plant (600 MW) was 9.9% below normal, while Illinois' 593-MW Double Black Diamond Solar Project was 27.6% above average.
Solar radiation is the mean surface downward shortwave radiation flux, measured from the fifth-generation European Centre for Medium-Range Weather Forecasts reanalysis. This variable includes direct and diffused solar radiation and is the model equivalent of global horizontal irradiance — the value measured by a pyranometer, a solar radiation measuring instrument. Wind speed is the value 100m above the ground from the same data set. The data is available at quarter-degree latitudes and longitudes, with a spacing of slightly over 27.5 km. This analysis compares the 2025 January values with the 20-year average (2004–2023) for January.
Data visualization by Chrisallen Villanueva.
This article was published by S&P Global Market Intelligence and not by S&P Global Ratings, which is a separately managed division of S&P Global.
For wholesale prices and supply and demand projections, see the S&P Global Market Intelligence Power Forecast.
Regulatory Research Associates is a group within S&P Global Commodity Insights.
S&P Global Commodity Insights produces content for distribution on S&P Capital IQ Pro.
Theme
Location
Products & Offerings
Segment