
Since the first publication of the S&P Indices Versus Active (SPIVA) U.S. Scorecard in 2002, S&P Dow Jones Indices has been the de facto scorekeeper of the ongoing active versus passive debate. The SPIVA Asia Ex-Japan Scorecard measures the performance of actively managed funds relative to relevant benchmarks, covering domestic equity, international equity and bond funds available in Greater China, Korea and Southeast Asia.
Mid-Year 2026 Highlights
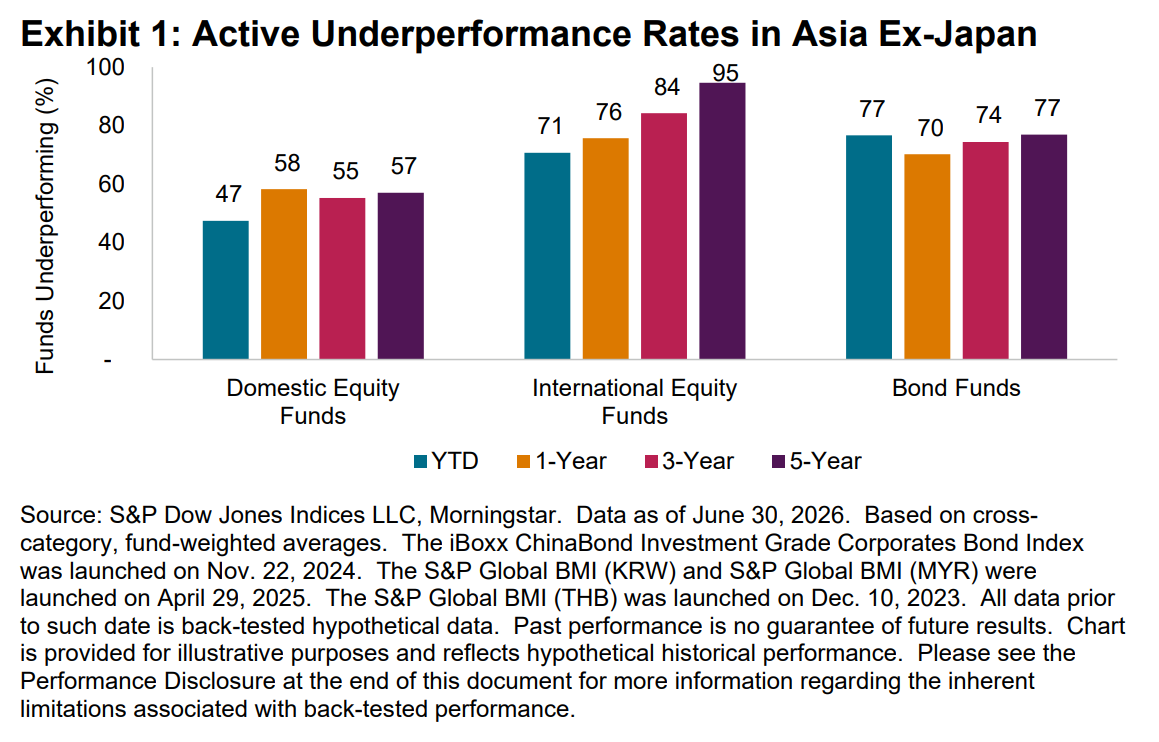
The first half of 2026 witnessed mixed results for active managers across Asia ex-Japan. While active funds in several domestic equity categories outperformed their benchmarks in aggregate, a majority of funds underperformed in every international equity and bond category. Underperformance rates generally increased over longer investment horizons.
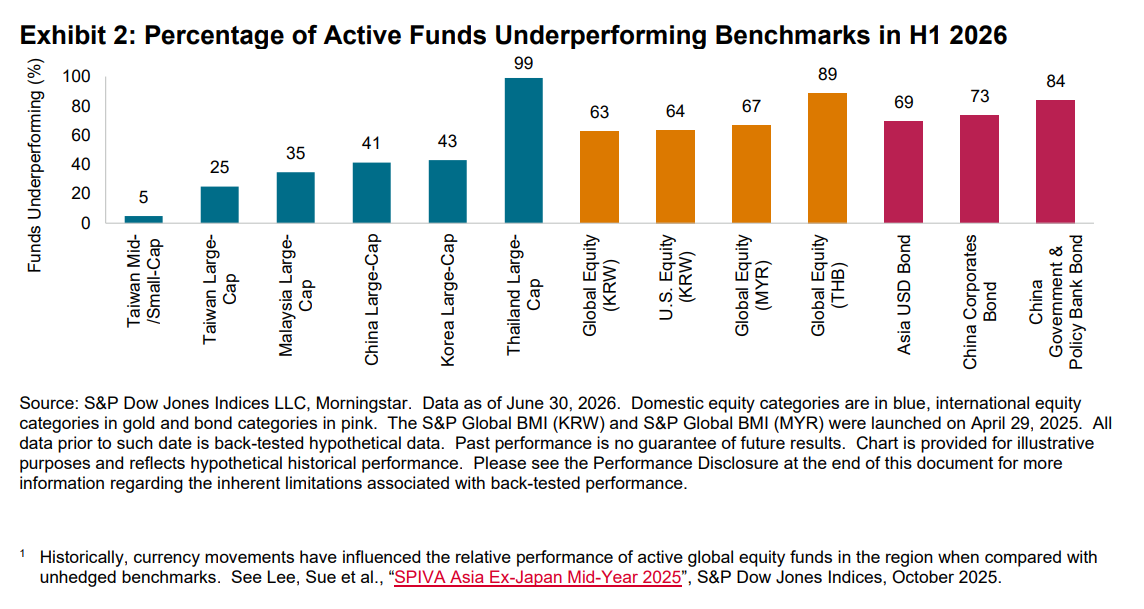
- Domestic equity funds delivered markedly different outcomes across markets. Taiwan remained the strongest market for active management, with only 25% of Taiwan Large-Cap funds and 5% of Taiwan Mid-/Small-Cap funds underperforming their relevant benchmarks in H1 2026. Malaysia, China and Korea also recorded majority outperformance, with underperformance rates ranging from 35% to 43%. In contrast, Thailand Large-Cap funds struggled significantly, with 99% of funds underperforming.
- International equity funds continued to face challenges despite broadly favorable market conditions for stock picking. Underperformance rates over the first half of 2026 ranged from 63% for Global Equity (KRW) funds to 89% for Global Equity (THB) funds. Currency hedging may have contributed to some of these results, as some funds employed currency hedging that would have detracted from performance amid the weakening of local currencies. Longer-term results remained even more challenging, with underperformance rates exceeding 90% in all four categories over five years (see Exhibit 8).
- Bond fund results were also weak. More than two-thirds of funds underperformed in each of the three bond categories during H1 2026. China Government and Policy Bank Bond funds experienced the highest underperformance rate, at 84%, followed by China Corporate Bond funds at 73% and Asia USD Bond funds at 69%.
- Fund survivorship remained high in the short term. Across all reported categories, 99.0% of funds survived through the first half of 2026. Even over five years, survivorship remained above 90% across all categories combined, indicating relatively low fund attrition across the region (see Report 2).