


Featured Topics
Featured Products


Events
Our Services


Investment Themes
Explore new territories with greater confidence


Equity
Fixed Income
Commodities
Multi-Asset
Sustainability
Dividends & Factors
Thematics
Our Exchange Relationships
S&P DJI combines global reach with local expertise, working with exchanges around the world to build indices for both the local and international investment communities.


Education


SPIVA®
For over 20 years, our renowned SPIVA research has measured actively managed funds against their index benchmarks worldwide.
Events & Webinars
Register to attend complimentary webinars and deepen your knowledge of current trends and issues impacting the index universe today.


Governance
Methodologies


Our Services
Professional Resources
Equity
Fixed Income
Commodities
Multi-Asset
Private Markets
Sustainability
Dividends & Factors
Thematics
Digital Assets
Indicators
Other Strategies
By Region
Our Exchange Relationships
S&P DJI combines global reach with local expertise, working with exchanges around the world to build indices for both the local and international investment communities.
Research & Insights
Education
Performance Reports
SPIVA®
For over 20 years, our renowned SPIVA research has measured actively managed funds against their index benchmarks worldwide.
Events & Webinars
Register to attend complimentary webinars and deepen your knowledge of current trends and issues impacting the index universe today.
Methodologies
SPICE
Your Gateway to Index Data
S&P Global Offerings
Featured Topics
Featured Products
Events

Global Core
Global markets are teeming with unknown variables. It helps to have a benchmark that isn’t.
As the first-ever float-adjusted global equity index, the S&P Global BMI has longer and more consistent history than any of its kind. Explore the many reasons it’s used by some of the world’s largest and most sophisticated asset managers and asset owners, who value it as a comprehensive and trusted dataset.
Discover:
- Comprehensive coverage
- A consistent approach
- Modular, non-overlapping subindices
- The foundation for a wide range of strategy indices
Comprehensive Coverage
The S&P Global BMI (Broad Market Index) series is designed to capture the global, investable opportunity set.
Spanning 48 developed and emerging market countries and more than 14,000 companies, it tracks over 99% of each constituent country’s available market capitalization. And it’s easy to slice and dice. Over 200,000 subindices are broken down by country, region, size, GICS® sector, and style, helping investors act on views broad and narrow. The S&P Frontier BMI covers an additional 32 frontier market countries.
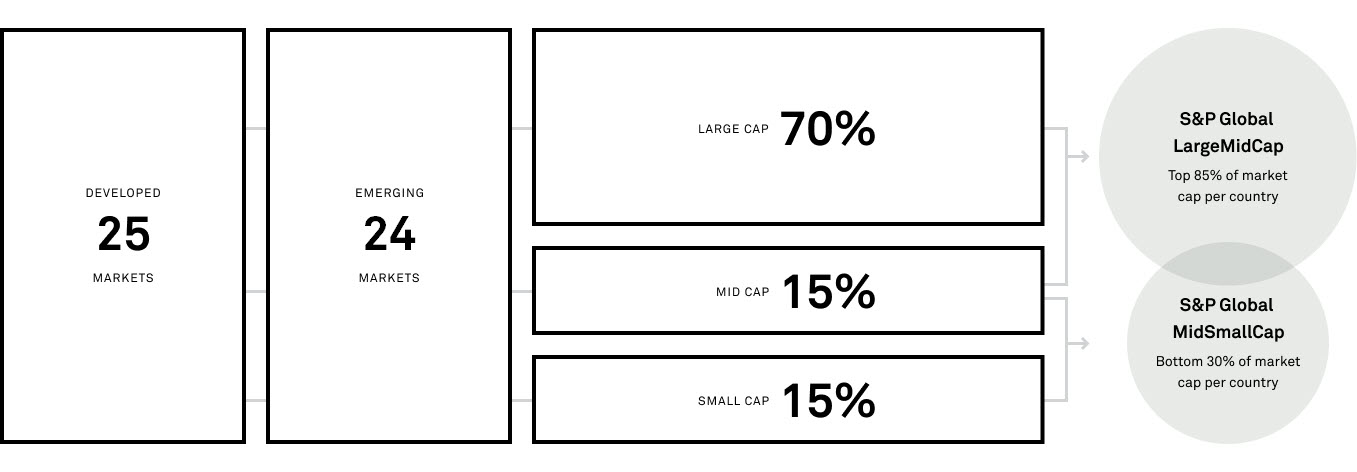
S&P Global BMI Series Countries
S&P Global BMI Size Indices
The S&P Global BMI includes all companies with float-adjusted market cap greater than USD 100 million meeting 6- and 12-month median value traded requirements. The S&P Global BMI is segmented into size indices based on cumulative market capitalization breakpoints within each country.
 Did you know?
Small-caps
As the first global index to cover the small-cap size range, the S&P Global BMI offers a deep small-cap segment and provides the most comprehensive measure of global small-cap securities in the market. The S&P Global SmallCap contains approximately 2,500 more companies than its comparable competitor indices.
A Consistent Approach
Modular, Non-overlapping Subindices
S&P Global BMI indices follow a flexible, customizable, building-block approach, allowing investors to seamlessly benchmark or achieve exposure to countries, regions, sectors, size segments, and investment styles that are backed by a common methodology. The family is designed with clearly defined divisions between segments and no gaps or overlaps in coverage, so market participants can avoid missing pieces of the market or accruing unwarranted, double-risk exposure.
 Did you know?
Eliminating Coverage Gaps
Competing indices may inadvertently create a gap in coverage by excluding Canadian securities. The S&P Developed Ex-U.S. BMI eliminates that gap, covering all 24 developed market countries outside the U.S.
The Foundation for a Wide Range of Strategy Indices
S&P Global BMI indices serve as performance benchmarks, the basis for passive investment products, and as a universe for historical market analysis and backtesting investment strategies. S&P Global BMI indices also serve as the foundation for more complex strategy indices, including those targeting factors and ESG. Using a comprehensive underlying global benchmark with consistent historical data helps to avoid unintended biases when constructing more complex strategy and custom indices.

Indices
More Resources
-
 Read on
The S&P Global BMI: Providing Consistent Insights into Global Equity Markets since 1989
-
 Watch the video
The S&P Global BMI: Cornerstone of Global Markets
-
 Download the report
S&P Global Equity Indices Monthly Update
-
 Explore
Index-Linked Products Based on S&P Global BMI Indices
-
 Visit our blog
New Insights on Global Markets
Not Registered?
Access exclusive data and research, personalize your experience, and sign up to receive email updates.
RegisterNot Registered?
Access exclusive data and research, personalize your experience, and sign up to receive email updates.
Register