











































Sector dynamics have become an increasingly important driver of equity market performance, but return dispersion across sectors and sector leadership can shift throughout the market cycle.
Andrea Ip and David Huang from State Street Investment Management (SSIM) and S&P DJI’s Amit Pathak explore how the S&P U.S. Sector Indices provide a precise framework for understanding key sector metrics and tracking meaningful underlying shifts. It examines historical patterns of sector dispersion, shifting leadership across market cycles and the role of sectors in portfolio construction.
U.S. sectors can offer Asian investors a practical way to better understand U.S. equity market dynamics, including more precise measurements to structural and cyclical trends shaping the global economy.
1. What are the S&P U.S. Sector Indices, why are they important and how are they used within the broader S&P DJI index ecosystem? (S&P DJI)
The S&P U.S. Sector Indices are a series of benchmarks that break down the U.S. equity market into its core economic segments using the Global Industry Classification Standard (GICS®), a widely adopted industry taxonomy. Instead of viewing the market as a single entity, these indices isolate sectors such as Information Technology, Health Care, Energy and Real Estate.
Sectors are important because market performance is not evenly distributed.For example, in 2025, when the S&P 500® rose by 18%, not every sector benefitted equally. The Communications Services sector gained a whopping 33%, while Real Estate posted only 3%. The gap between the best and worst S&P 500 sectors exceeded 30 percentage points, highlighting the impactful role U.S. sectors play in modern markets (see Exhibit 3).
While the S&P 500 provides a broad snapshot of large-cap U.S. equities, there are important differences beneath the surface.
Market participants with specific views—such as growth in Artificial Intelligence (AI) infrastructure or rising defense spending— often require more targeted benchmarks. Sector indices allow them to zoom in on these themes.
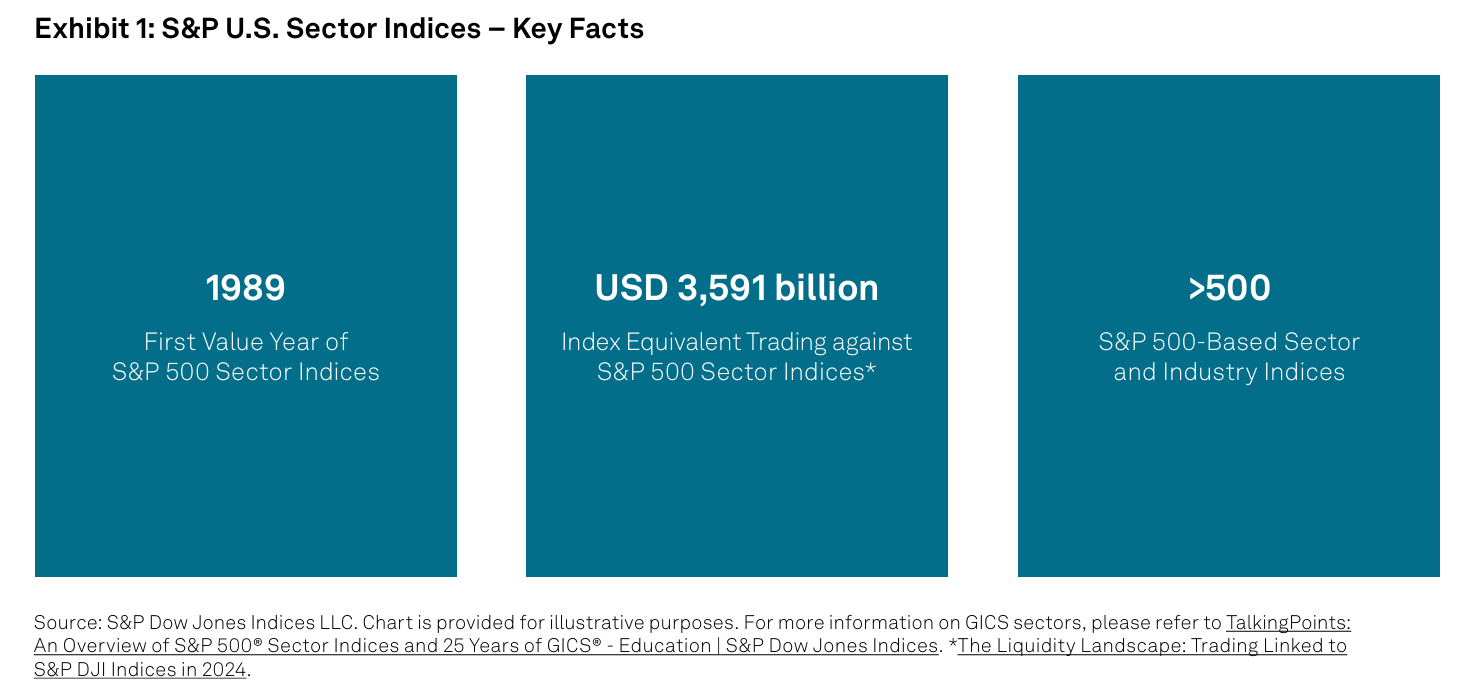
Within financial markets, sector indices and sector-linked products serve several key functions.
Sector Indices
- Benchmarking: Comparing performance against a specific part of the economy
- Risk attribution: Identifying whether performance comes from sector or stock selection
- Investment products: Forming the basis for ETFs, futures and options
Sector-Linked Products
- Tactical allocation: Shifting exposure based on economic cycles
- Risk management: Gaining exposure to sector-leading companies without single company risk
Together, they provide both analytical clarity and practical tools for implementation.
Sector indices also play an important role within the broader S&P DJI index ecosystem. They represent one layer in a hierarchical framework that spans from broad market benchmarks to core economic segments. Investors can move between different levels of granularity—from total market indices down to sector- and industry-specific indices.
