


Summary
In recent years, the largest names in the U.S. equity market have played an increasingly prominent role in shaping market narratives, leading headlines and exerting sizeable influence on the performance of major indices. Fueled by market participants’ enthusiasm for themes such as artificial intelligence, resilient corporate earnings and strong positions in key growth sectors—particularly technology—this group continues to remain a focal point with a prominence that extends beyond the U.S.
The S&P 100® measures these leaders by tracking 100 of the largest and most established U.S. blue chip companies. Constituents are drawn from the S&P 500®, with the largest companies with listed options generally selected for index inclusion.
Here, we will explore key insights from the S&P 100, including:
- Relevance of the S&P 100 to global market participants;
- Index composition and historical performance; and
- Index construction.
Global Relevance of the S&P 100
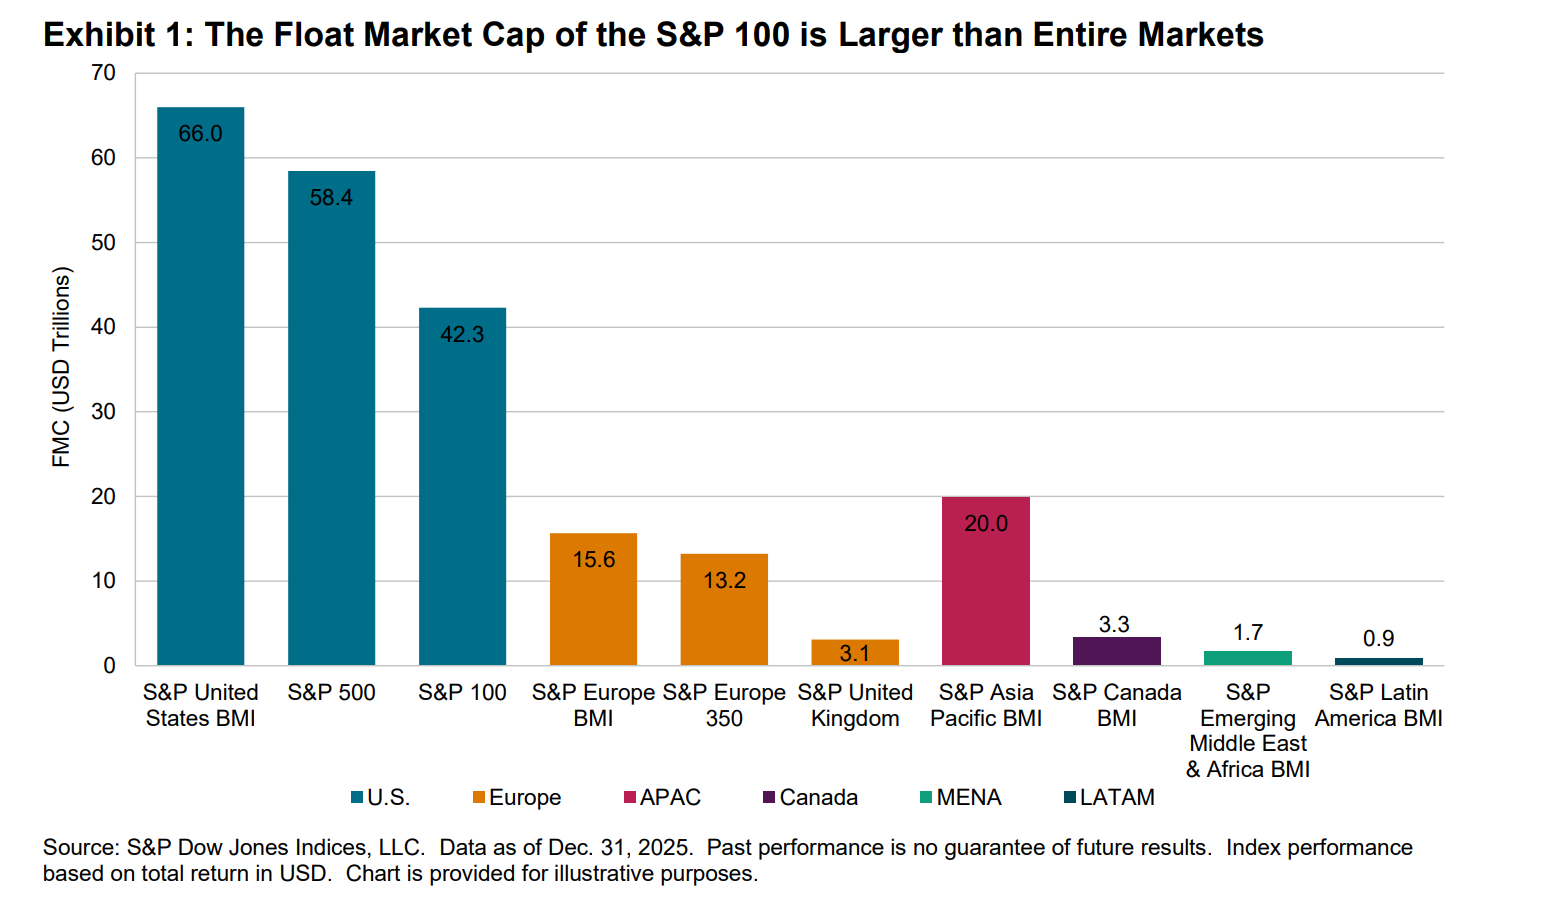
With a float market capitalization (FMC) of USD 42.3 trillion, the size of the S&P 100 rivals that of entire regional equity markets. Exhibit 1 shows how the S&P 100 compares with other key indices. Despite making up less than 1% by constituent count within the S&P Global BMI, the S&P 100 represents more than double the size of both the S&P Asia Pacific BMI and the S&P Europe BMI, two-thirds of the S&P United States BMI and around 40% of the USD 107.5 trillion global market.
Beyond their collective scale, S&P 100 companies also account for a significant share of global sectors. Exhibit 2 compares the representation of S&P 100 constituents with those of the S&P Global BMI across each of the eleven GICS® sectors. The sizeable proportion of these U.S. blue chips within certain sectors reflects their recent outperformance, particularly in Communication Services and Information Technology, where a small number of names—9 and 17 by count—represent 67.7% and 61.5% of each global sector’s respective market capitalization. Given that the S&P Global BMI comprises nearly 15,500 constituents, these proportions are substantial. Elsewhere, several other sectors also see a meaningful share of their value represented by S&P 100 companies.
