






































IN THIS LIST

Mid-Cap Express

SPIVA Around the World

Celebrating 30 Years of the S&P Composite 1500

A Tale of Two Markets

Fundamental Weighting for Long-Term Outperformance and Enhanced Diversification: The S&P 500 Revenue-Weighted Index

Mid-Cap Express

The mid-cap segment of the U.S. equity universe, as represented by the S&P MidCap 400®, has historically offered distinct views in terms of concentration, sector weights and return drivers. This prompts an exploration of whether these trends are reflected in the S&P MidCap 400 Scored & Screened Index,1 which is a broad-based, market-cap-weighted index designed to measure the performance of securities meeting sustainability criteria, while maintaining similar overall industry group weights as the S&P MidCap 400.2

Starting with concentration, Exhibit 1 illustrates the weight of the 10 largest stocks in the S&P MidCap 400 Scored & Screened Index since its launch on Jan. 11, 2021, to April 30, 2025. The average weight stood at 9.20%, slightly higher than the S&P MidCap 400's 6.35%. However, this concentration was significantly lower than the S&P 500 Scored & Screened Index, where the 10 largest stocks accounted for an average weight of 37.82% versus 30.05% for the S&P 500®. This indicates that while the S&P MidCap 400 Scored & Screened Index showed some concentration, it still retained greater diversification compared to its large-cap counterpart.

Next, we direct our attention to sectoral weights and their relation to excess return in the S&P MidCap 400 Scored & Screened Index versus the S&P MidCap 400. Exhibit 2 summarizes the results of the Brinson3 attribution analysis for the year ending April 30, 2025. The S&P MidCap 400 Scored & Screened Index outperformed the S&P MidCap 400 by 0.32%, primarily due to stock selection effects (0.29%) as opposed to sector weighting effects (0.03%). This aligns with the index's construction methodology, which aims to maintain overall similar industry weights to the S&P MidCap 400.

Further analysis of excess returns reveals key distinctions between the S&P MidCap 400 Scored & Screened Index and its large-cap counterpart, the S&P 500 Scored & Screened Index. Exhibit 3 summarizes the results of a similar Brinson2 attribution analysis and shows that the S&P 500 Scored & Screened Index underperformed the S&P 500 by 2.82% over the one-year period shown, primarily due to negative stock selection effects (-2.64%). Sector contributions varied significantly: the performance of the S&P MidCap 400 Scored & Screened Index was boosted by the Health Care (0.86%) sector, while Industrials (-0.64%) contributed negatively to performance (see Exhibit 2). Conversely, the S&P 500 Scored & Screened Index faced significant negative selection effects in Information Technology (-1.11%) and Communication Services (-1.09%), with only a minor negative stock selection effect from Health Care (-0.03%; see Exhibit 3).

In summary, past results underscore the distinct differences in concentration, sector exposures and return drivers between the S&P MidCap 400 Scored & Screened Index and the S&P 500 Scored & Screened Index, reflecting the historical trends in their respective broad market benchmarks. Given these insights, the S&P MidCap 400 Scored & Screened Index shows its potential as a diversified benchmark for the mid-cap U.S. equity universe while pursuing sustainability criteria.

1 Formerly known as the S&P MidCap 400 ESG Index.

2 See the S&P Scored & Screened Index Series Methodology.

3 For more information on this widely used performance attribution model, see Brinson, Gary P., Hood, L. Randolph, Beebower, Gilbert L., "Determinants of Portfolio Performance," Financial Analysts Journal, July-August, 1986.


SPIVA Around the World

Contributor Image
Nick Didio

Quantitative Associate, Index Investment Strategy

S&P Dow Jones Indices

S&P DJI's SPIVA (S&P Indices versus Active) Scorecards have been measuring active funds' performance against appropriate benchmarks for over 20 years. With the release of the SPIVA Asia Ex-Japan Year-End 2024 Scorecard, our latest regional addition, all 11 regional SPIVA Scorecards tracking fund performance in 2024 are now available.

2024 was another challenging year for active managers, with a cross-category, fund-weighted average of 71% of equity funds listed across all regions in Exhibit 1 underperforming their respective benchmarks. Exhibit 1 shows the underperformance rates by region for selected equity fund categories across 1-, 3- and 5-year horizons. Note that majority outperformance in 2024 was only achieved by active managers in Mexico, South Africa and the MENA region.

U.S. dominance prevailed versus the rest of the world, with the S&P 500® up 25.0% in 2024, outperforming the S&P World Ex-U.S. Index by 19.2%. Large-cap dominance meant a higher hurdle for active managers to climb, with only 28% of constituents outperforming the S&P 500. Given the increasing concentration and outperformance of the largest stocks in 2024, it is unsurprising that 65% of large cap managers, who may often be underweight the largest stocks,1 underperformed The 500™.

The challenge of stock selection was not a phenomenon unique to the U.S. in 2024—it was also observed globally, as 59% of stocks on average failed to beat their respective benchmarks globally (see Exhibit 2). Chile, Mexico and South Africa were bright spots, with only 39%, 47% and 52% of stocks underperforming their respective benchmarks, coinciding with majority outperformance rates in two of the three regions: Mexico and South Africa.

While generating outperformance was tough for stock pickers, fixed income managers performed relatively better than their equity peers, with only 48%2 of funds listed across all regions in Exhibit 3 underperforming their respective benchmarks. In the U.K., German and U.S. bond markets, the beginning of 2024 saw heightened interest rates and an inverted yield curve that disinverted throughout the year. Bond managers who shortened their duration exposures may have been the benefactors of such an environment. Exhibit 3 shows underperformance rates by region for selected fixed income fund categories across 1-, 3- and 5-year horizons.

Tilting toward riskier credit segments was a potential tailwind for bond managers in regions like the U.S., with a 7% excess return between the iBoxx $ Liquid High Yield Index and iBoxx $ Liquid Investment Grade Index. Only 30% of Investment-Grade funds underperformed the iBoxx $ Liquid Investment Grade Index compared to 66% of High Yield funds versus the iBoxx $ Liquid High Yield Index. European credit managers also fared well, with majority outperformance rates for euro-denominated corporate and high yield funds.

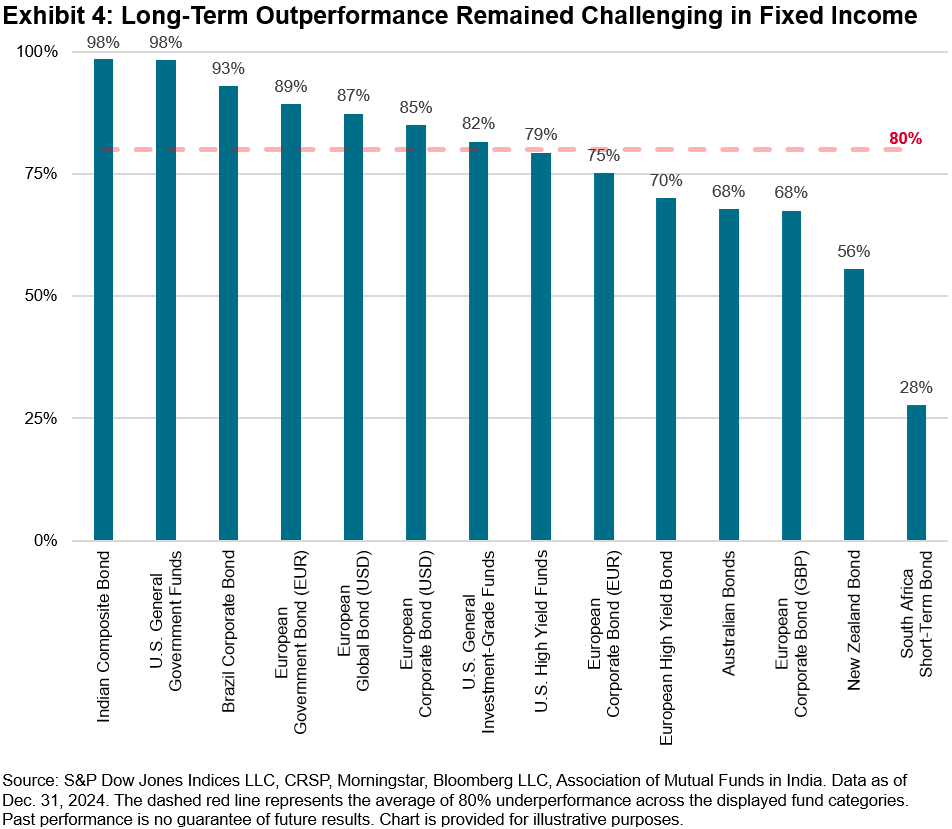
Despite strong relative performance in 2024 from most fixed income fund categories, the long-term trends of underperformance remained. Exhibit 4 shows that, on average, 80%3 of funds in categories included in Exhibit 3 underperformed their respective benchmarks over the 10-year horizon. Only one fixed income category, the South Africa Short-Term Bond benchmarked against the STeFi Composite, recorded majority outperformance over the past 10 years.

While active manager performance varies across regions and across asset classes, one trend remained true: outperforming the benchmark is difficult, especially over the long term. Find out more from our SPIVA Library.

1 Chan, Fei Mei and Lazzara, Craig, "Degrees of Difficulty", S&P Dow Jones Indices, January 2022

2, 3 Cross-category, fund-weighted average


Celebrating 30 Years of the S&P Composite 1500

Contributor Image
Hamish Preston

Head of U.S. Equities

S&P Dow Jones Indices

Launched on May 18, 1995, the S&P Composite 1500® (the S&P 1500™) celebrated its 30th anniversary yesterday. Designed for investors looking to replicate the performance of the U.S. equity market or to benchmark against a representative universe of tradeable stocks, the S&P 1500 combines the S&P 500®, S&P MidCap 400® and S&P SmallCap 600® indices in proportion to their free-float market capitalizations. Exhibit 1 shows that the S&P 1500 covered more than 95% of the U.S. equity market's USD 53.7 trillion float market capitalization—as measured by the S&P Total Market Index—at the end of April 2025.

Despite majority representation from large-cap companies—S&P 500 companies accounted for USD 47.2 trillion of the S&P 1500's USD 51.1 trillion index market capitalization at the end of April, and an average of 89% of the S&P 1500's weight at the end of each year between 1995 and 2024—market participants may have found it beneficial to incorporate smaller U.S. equity size segments.

Indeed, mid- and small-cap U.S. equities have distinct characteristics and market participants risk overlooking a sizeable portion of the global equity opportunity set by ignoring them: smaller U.S. size segments are as large as some countries' entire equity markets. Exhibit 2 shows that the S&P 1500 benefited from its exposure to smaller size segments, slightly outperforming the S&P 500 over the past 30 years.

An important observation about the S&P 1500 is that is it not simply the largest 1500 U.S.-domiciled companies since index additions must meet various criteria. Exhibit 3 summarizes many of the criteria that are outlined in the S&P U.S. Indices Methodology. For example—and unlike many other U.S. equity indices—the S&P 1500 and its component indices utilize an earnings screen whereby new additions must have a history of positive earnings before they can be considered eligible for addition to the S&P 500, S&P 400® or S&P 600®.

One way to see the impact of the S&P 1500's index construction is to compare the characteristics of S&P 1500 stocks with "Extra 1500" stocks. The latter group consists of the largest 1,500 U.S. stocks that were not members of the S&P 1500 at the end of April 2025. Exhibit 4 points to the S&P 1500 being an efficient measure of the U.S. equity market: the S&P 1500 avoided many of the less liquid, lower priced and lower quality stocks in the "Extra 1500."

The S&P 1500 Index's 30th anniversary offers a chance to reflect on its performance, characteristics and potential applications. Here's to the next 30 years!


A Tale of Two Markets

Contributor Image
Anu R. Ganti

Head of U.S. Index Investment Strategy

S&P Dow Jones Indices

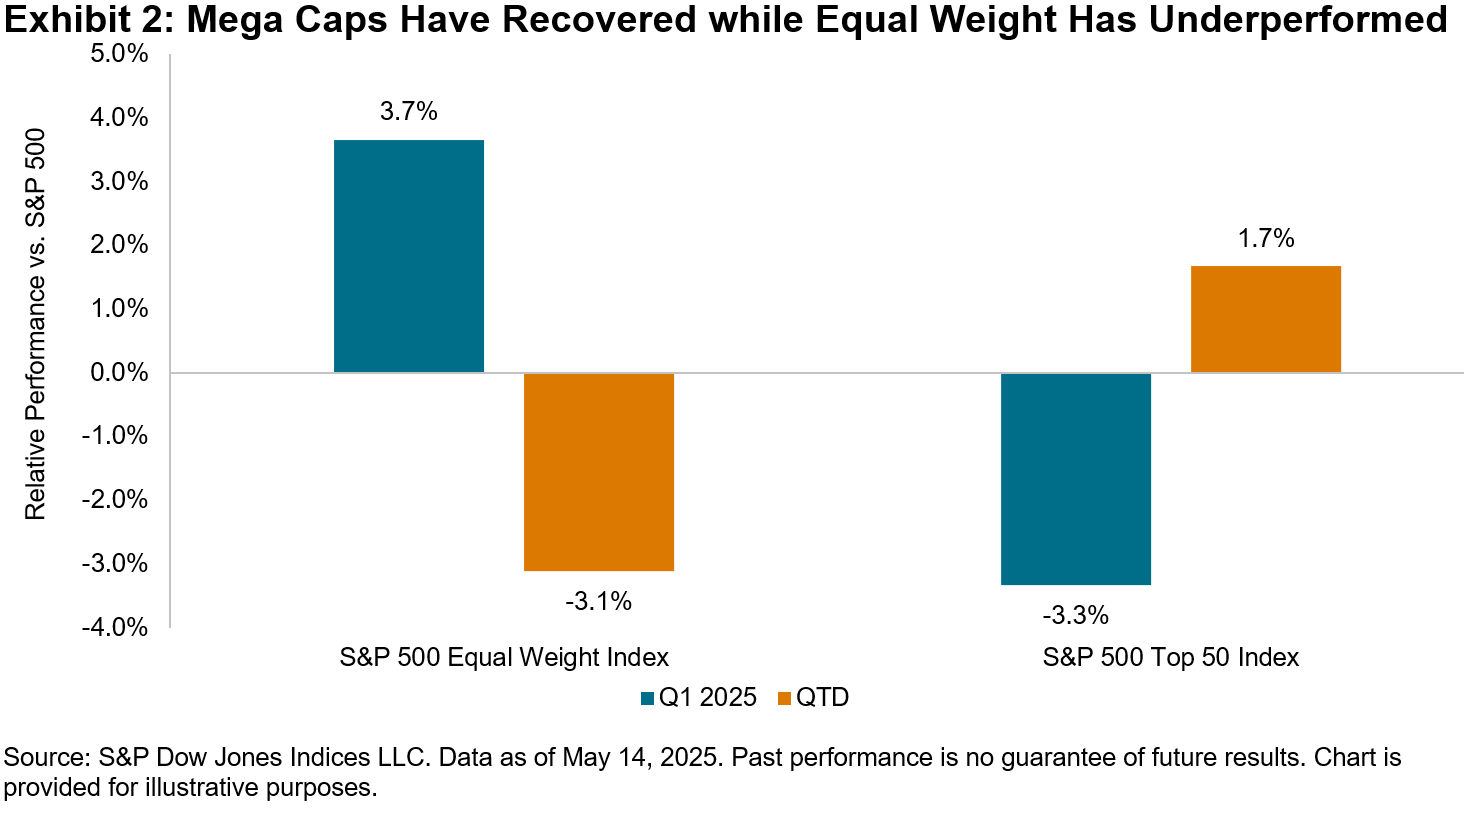
After the volatility witnessed in early April, U.S. equities have staged a remarkable recovery over the past couple of weeks, with the S&P 500® up 1% YTD through May 15, 2025, reversing its 15% YTD decline through April 8, 2025. Thanks to optimism surrounding easing tariff tensions and strong Big Tech earnings, mega caps have rebounded, with the S&P 500 Top 50 outperforming The 500™ by 1.2% QTD.

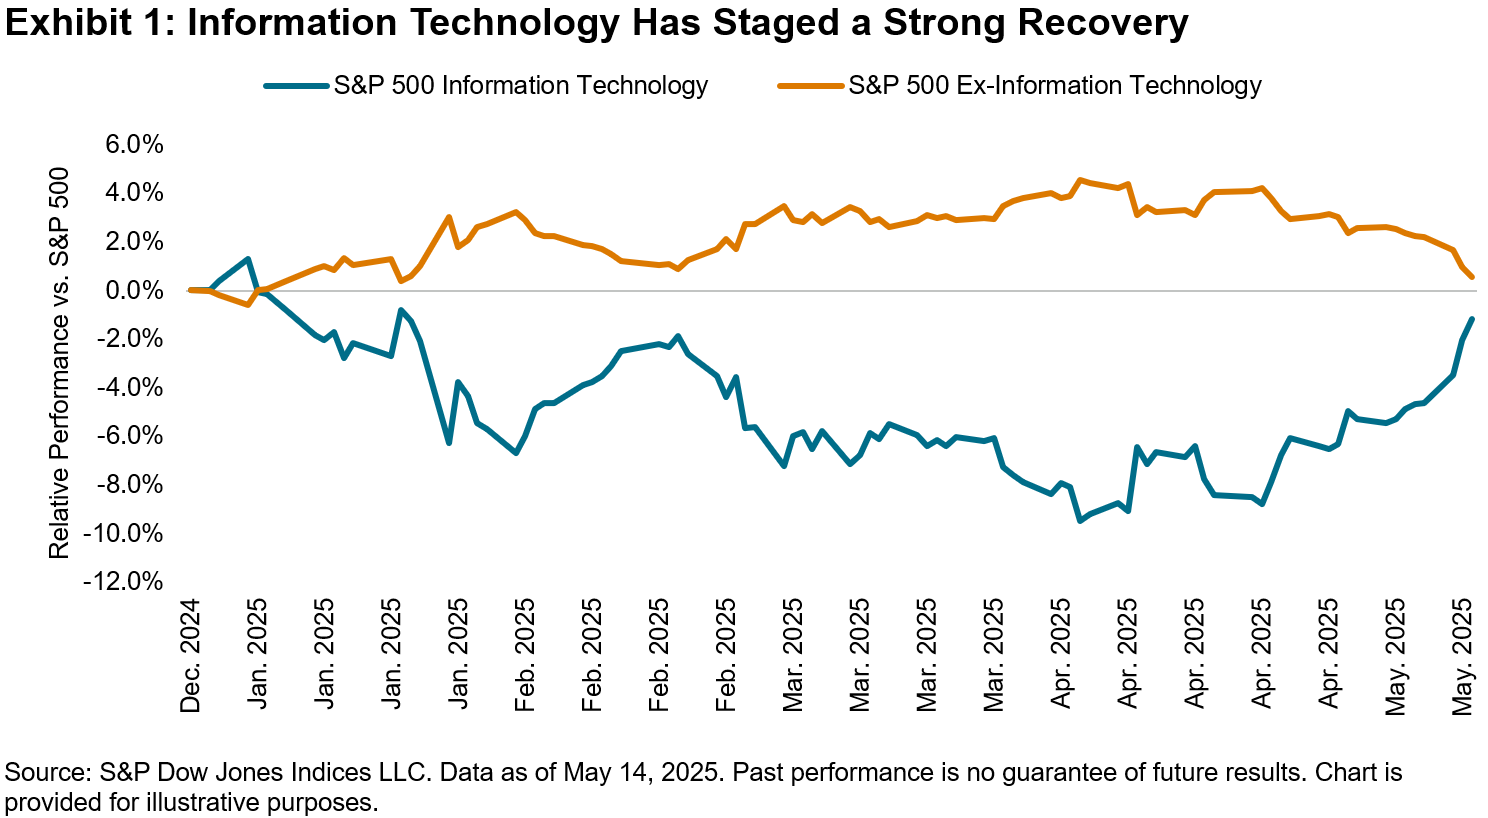
The outperformance of larger stocks has been driven by the Information Technology (IT) sector, with the S&P 500 Information Technology up 14% QTD. Exhibit 1 illustrates that the disparity in performance between IT and the rest of the market has narrowed since the early April turmoil, as stocks from the sector have strengthened. The S&P 500 Information Technology has underperformed The 500 by 2% while the S&P 500 Ex-Information Technology has outperformed by 0.8% YTD.

Meanwhile, the S&P 500 Equal Weight Index, which has a smaller-cap bias by design, has underperformed The 500 by 3% so far this quarter. Exhibit 2 shows that the outperformance of mega caps and underperformance of equal weight has been a notable reversal compared to Q1 2025, which was characterized by mega-cap underperformance and equal weight's outperformance.

Combining a size perspective with a sector perspective through a sector attribution of the S&P 500 Equal Weight Index versus the S&P 500 can help to understand the shifts in the equal weight index's relative performance seen in Exhibit 2. Exhibit 3 illustrates that cross-sector weighting, or sector weight differences, were the key driver of the index's outperformance in Q1 2025, stemming primarily from the underweight to IT. In contrast, so far this quarter, the underweight to IT has turned from a performance contributor to a performance detractor, consistent with the sector's recent strong performance.

Although IT has made a significant comeback, the sector's diversification properties have diminished. In Exhibit 4, we calculate the spread in trailing 12-month volatility between the S&P 500 versus the S&P 500 Ex-Information Technology. When this spread is positive, the inclusion of the sector increases volatility in the benchmark; when negative, the sector acts as a diversifier. Note that the positive spread for IT has continued to increase, approaching levels last seen during the Tech bubble.

Zooming out, Exhibit 5 indicates that dispersion among S&P 500 sectors has trended upward since the start of the year. With a 24% QTD performance spread between the leading Information Technology and laggard Health Care sectors, sector allocation decisions may continue to be especially important.


Fundamental Weighting for Long-Term Outperformance and Enhanced Diversification: The S&P 500 Revenue-Weighted Index

Contributor Image
Wenli Bill Hao

Director, Factors and Dividends Indices, Product Management and Development

S&P Dow Jones Indices

By weighting the constituents of the S&P 500® based on top-line revenue, the S&P 500 Revenue-Weighted Index offers an alternative to traditional benchmarks that are weighted by float market cap (FMC). This approach aims to better reflect the fundamental strength of each company, while offering better valuations and enhanced diversification. In this blog, we will analyze its methodology, examine short- and long-term performance, explore style tilts and assess diversification.

Year-to-Date Performance

So far this year, the S&P 500 Revenue-Weighted Index has outperformed The 500™ by more than 4.5% and surpassed the S&P 500 Equal Weight Index by more than 2.0% (see Exhibit 1).

Long-Term Performance

This recent outperformance is consistent with its historical track record. As shown in Exhibit 2, the S&P 500 Revenue-Weighted Index has outperformed both the S&P 500 and S&P 500 Equal Weight Index in terms of total return and risk-adjusted return over the long term, all while maintaining consistently lower volatility.

Upside Participation and Downside Protection

The historical capture ratios (Exhibit 2) show that the S&P 500 Revenue-Weighted Index has typically participated one-for-one in up markets,1 while delivering significant outperformance during down markets. This aligns with the design of revenue-weighted indices, which tend to provide a closer reflection of the broader economy and avoid overweighting overvalued stocks.

Methodology

The S&P 500 Revenue-Weighted Index assigns weights to its constituents proportional to their revenues from the past four quarters. To provide broader coverage and reduce concentration risk, individual constituent weights are capped at 5%, and the index rebalances quarterly in March, June, September and December.

Weighting by revenue may better reflect the broader economy, as revenue is directly tied to economic activity. Additionally, revenue serves as a direct indicator of a company's ability to generate income and is less susceptible to accounting manipulations.

Valuations

As illustrated in Exhibits 3a and 3b, the S&P 500 Revenue-Weighted Index generally exhibited better valuations than the S&P 500 Equal Weighted Index and The 500.2

Sector Weights

As shown in Exhibit 4, revenue weighting has often resulted in more stable sector weights (as measured by lower standard deviation) compared to the weighting scheme driven by price, as revenues tend to be relatively stable. Moreover, the S&P 500 Revenue-Weighted Index held the largest weight in Consumer Discretionary, while Information Technology was the largest sector in The 500.

Diversification

When examining individual stocks, the S&P 500 Revenue-Weighted Index demonstrated greater diversification than The 500, featuring a lower max stock weight and a higher effective number of stocks (see Exhibit 5).

Conclusion

The S&P 500 Revenue-Weight Index presents an alternative to traditional market cap-weighted benchmarks, emphasizing fundamentally strong companies based on revenue. It has consistently delivered robust total returns and risk-adjusted outperformance over both the short and long term. In comparison to FMC-weighted benchmarks, it has historically offered greater value tilt, reduced concentration risk and more stable sector weights.

1 The market is defined as the monthly performance of the underlying benchmark (i.e., S&P 500) from Dec. 31, 1994, to March 31, 2025.

2 Historic price/book ratios show a similar trend to price/earnings and price/sales ratios.

3 Effective number of stocks is the inverse of the Herfindahl-Hirschman Index (HHI), which is the sum of squared stock weights for each index in each period.