


Summary
Buffeted by geopolitical, tariff and inflation-related tensions, U.S. equities skirted bear market territory in early April before staging a tech-fueled rapid recovery. Sailing through a subsequent government shutdown and concerns over labor market weakness, the the S&P 500® notched up 39 record closing highs to finish the year up 18%. Fixed income markets also gained ground, propelled by optimism surrounding U.S. Federal Reserve rate cuts.
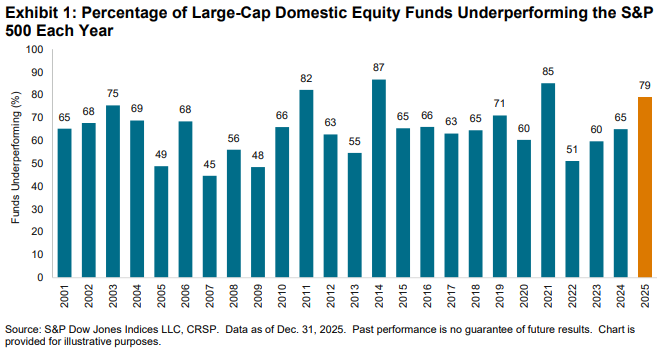
In our largest and most closely watched comparison, 79% of all active large-cap U.S. equity funds underperformed the S&P 500, worse than the 65% rate observed in 2024 and the fourth-worst year for active large-cap managers over the 25-year history of our SPIVA Scorecards. Headwinds from unrelenting large-cap outperformance subsumed the tailwinds from higher dispersion, resulting in fewer potential opportunities for stock pickers to capitalize on.
The 500® outperformed the S&P MidCap 400® by 10% and the S&P SmallCap 600® by 12% in 2025, creating opportunities for mid- and small-cap managers to tilt toward the larger end of the capitalization range to generate greater relative outperformance. It was the third consecutive year in which the large-cap benchmark outperformed its mid- and small-cap counterparts. 55% of All Mid-Cap funds and 41% of All Small-Cap funds underperformed.
The fortunes of managers focused on international equities were challenged, as evidenced by 63% of International funds and 76% of Global funds underperforming their respective benchmarks. With the U.S. comprising more than 70% of the weight of the S&P World Index, and the S&P World Ex-U.S. Index outperforming the S&P World by 11% in 2025, managers that were overweight the U.S. may have been hurt accordingly. Emerging market managers fared relatively better: 53% of Emerging Markets funds underperformed the S&P Emerging Plus Index.
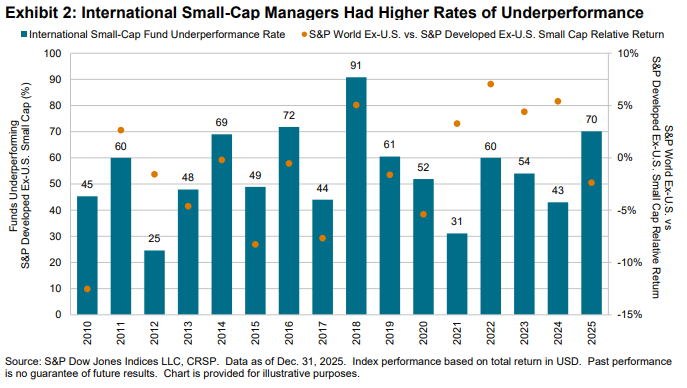
In contrast to their U.S. peers, international small-cap managers struggled: 70% of International Small-Cap funds underperformed the S&P Developed Ex-U.S. Small-Cap. The benchmark led among our reported equity category benchmarks, up 35% in 2025, outpacing the S&P World Ex-U.S. by 2%. The challenge of a high hurdle to beat combined with limited opportunities to tilt toward mid and large caps were dueling headwinds to contend with.
Results for bond managers were poor, with a cross-category average underperformance rate of 70%, higher than the 62% observed across equities. 82% of General Investment-Grade and 76% of High Yield funds underperformed. Perhaps aided by the tailwind of a weakening U.S. dollar, Emerging Market Debt was a bright spot and the sole fixed income category to post majority outperformance, with only 31% of Emerging Market Debt funds underperforming.
