


Blog — 13 Dec, 2022
Data Stories: Three Steps to Assess Carbon Reduction Performance
By Sue Ge and Yoshie Maeda

As climate change impacts are turning visible worldwide, pressure on the private sector to reduce greenhouse gas (GHG) emissions is growing — but responses vary. Some companies disclose their emissions, others explain their reduction procedures and, yet others, set reduction targets.
Carbon emissions baseline analysis, carbon price risk and transition pathway analysis are important components for measuring corporate transition risk and are being widely used to assess corporate emission reduction efforts.
This article introduces three carbon-related datasets developed by S&P Global Trucost, part of S&P Global Sustainable1. It covers three time perspectives — present, future and current trend — to evaluate performance on corporate carbon emission reductions to mitigate climate risk.
Which Company Has Low/High Carbon Risk?
In general, carbon risk is higher for high-emitting sectors, which increases the urgency to take action given the cost and time required for these sectors to adapt, as well as the opportunity they may have to leverage alternative technologies. Among various climate change datasets provided by S&P Global Market Intelligence, Trucost Environmental, Carbon Earnings at Risk (CEaR) and Paris Alignment Datasets can help investors capture and analyze their carbon risk.
Table 1: Three Aspects to Evaluate Carbon Performance
|
Current Emission |
Trucost Environmental Dataset: |
|
Financial Risk of Carbon Cost |
CEaR Dataset: Estimated future carbon cost based on current emissions, which suggest the severity of required carbon reduction efforts |
|
Reduction Trend |
Paris Alignment Dataset: The alignment of past and future trend of carbon emissions with ideal emission paths that align with the Paris Agreement goal to limit global warming to well below 2°C from pre-industrial levels |
Source: S&P Global Trucost data from S&P Global Sustainable1 as of November 2022. Table is for illustrative purposes only.
Current GHG Emissions: Trucost Environmental
In the past two years, we have seen increasing demand of GHG emissions data by various market participants in APAC to help evaluate their carbon risk exposure. The Environmental Dataset covers scrutinized GHG emissions data and their intensities for a universe of over 15,000[1] companies, representing 98% of global market capitalization. This includes hundreds of environmental issues encompassing carbon and other pollutants, water dependency, natural resource efficiency and waste disposal. For companies without disclosed emission, estimated values are also available. Emissions, or emission intensity, and disclosure are the fundamental data to consider when it comes to assessing company carbon risk.
Emission and Intensity
One of the simplest methods to assess a company's carbon efficiency is to compare its GHG intensity with that of its peers in the same industry, or with the industry average. If intensity is higher, then more can be done. Although each company has its own circumstances preventing or accelerating appropriate actions, understanding the current level of emissions is the starting point for evaluating improvement over time.
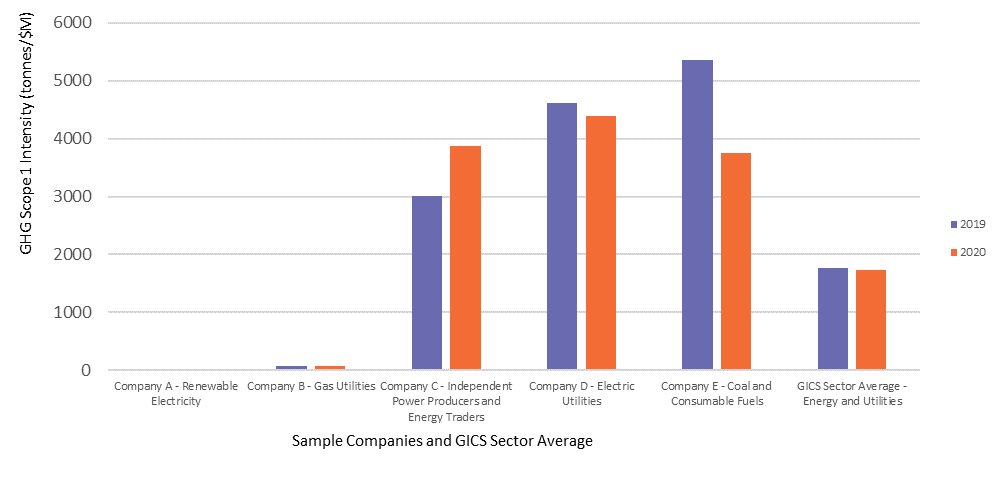
Among the five energy and utility companies operating in the APAC region chosen for this analysis, the intensity of Company A, which produces electricity using renewable energy, is much lower than Company C, D and E whose businesses are highly involved in the use of conventional fossil carbon-based fuels. It is also lower than the GICS sector average. While carbon intensity for the overall industry decreased slightly from 2019 to 2020, Company E put extra effort on reducing its carbon emissions, as shown in Figure 2 by the decrease of carbon intensity from more than 5,000 tonnes/$M to approximately 3,800 tonnes/$M. In contrast, Company C showed an increasing carbon intensity, which exposes it to higher carbon risk.
Figure 2: GHG Scope 1 Emission Intensity (tonnes/$M) for Sample Companies in APAC Energy and Utility Sector
Source: S&P Global Trucost data from S&P Global Sustainable1 as of November 2022. Charts are for illustrative purposes only.
Disclosure
The first step for companies to tackle carbon issues is to calculate and disclose their current carbon emissions. The process to review the calculation and collect data from all entities within the enterprise can be time-consuming, but it is an essential starting point. The Environmental Dataset provides thoroughly reviewed disclosed GHG data by public companies, and fully or partially modeled GHG data for companies without satisfactory disclosure.
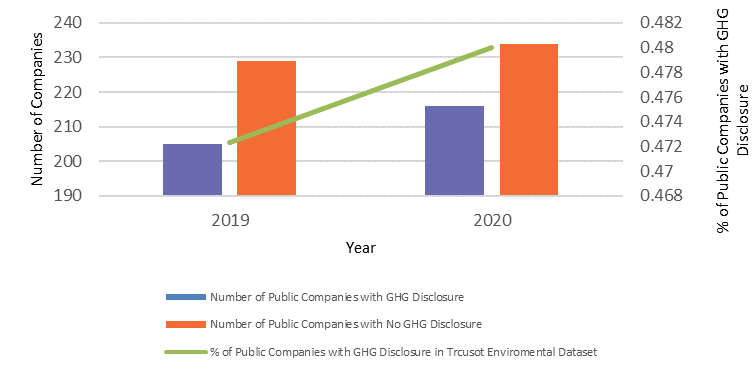
The disclosure status shows that a company recognizes its major emission sources and emission conditions, which can help set goals for improvement. In the past two years, an increasing number of energy and utility companies in APAC have reported their GHG emissions, as shown in Figure 3. The improvement of environmental disclosure applies to almost all industries and is likely in response to growing pressure from regulators and investors for more transparency.
Figure 3: Increasing Number of Public Companies Covered by Trucost Database Report GHG Scope 1 Emissions in the Energy and Utility Sectors in APAC Region
Source: S&P Global Trucost data from S&P Global Sustainable1 as of November 2022. Charts are for illustrative purposes only.
Disclosure status and emission intensity are key factors to evaluate as baseline data. Deeper analysis of companies can then be done using forward-looking carbon risk data.
Financial Risk of Increasing Carbon Cost: CEaR
As mitigation pressure rises, total carbon cost is expected to rise and financially impact companies. The CEaR Dataset can be used to stress test a company’s current ability to absorb future carbon prices and understand potential earnings at risk. Integral to this analysis is the calculation of the Unpriced Carbon Cost, which is defined as the difference between what a company pays for carbon today and what it may pay at a given future date based on its sector, operations and a given policy price scenario. If the future cost is estimated to be quite high relative to EBITDA, it clearly shows a risk of becoming a stranded asset in the future and the necessity of drastic carbon reduction as soon as possible.
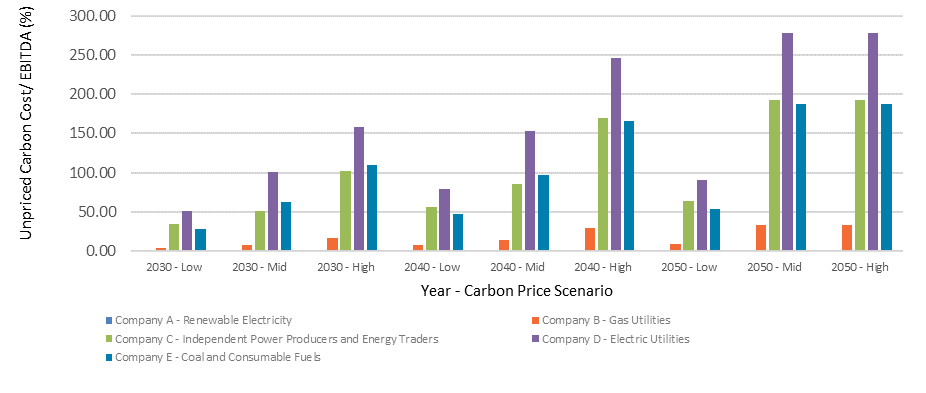
Figure 4: Carbon Price Risk Analysis for Sample Companies
Source: S&P Global Trucost data from S&P Global Sustainable1 as of November 2022. Charts are for illustrative purposes only.
Figure 5 shows that Company D is exposed to much higher transition risk under different carbon pricing scenarios (Low, Medium and High) from 2030 to 2050 compared to the other four companies. Estimated carbon cost per EBITDA ranges from 50% to more than 250%, indicating that the extra cost from carbon emissions will significantly deteriorate the company’s financial performance. There are two possible reasons behind the analytical results:
- Company D is a large emitter with the highest current GHG emissions.
- Company D operates in regions that need to implement mitigation policies that result in higher carbon prices in the future to be aligned with 20C target, according to OECD and IEA research.
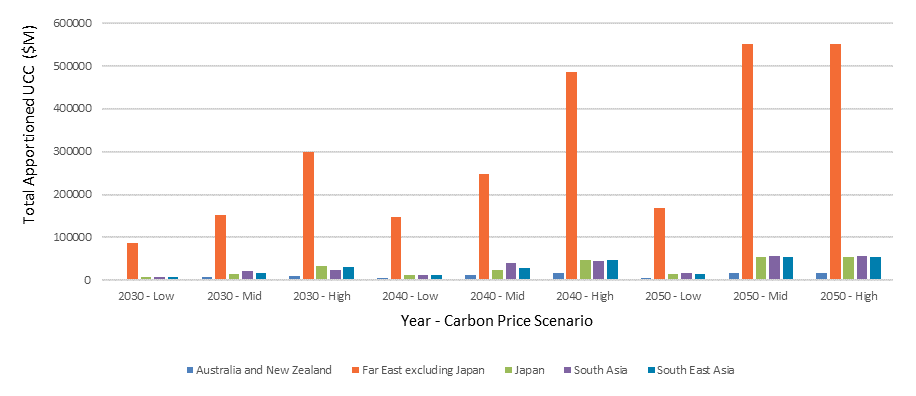
Figure 5: Total Apportioned Unpriced Carbon Cost by Subregion for APAC Energy and Utilities Sector
Source: S&P Global Trucost data from S&P Global Sustainable1 as of November 2022. Charts are for illustrative purposes only.
When looking further at the unpriced carbon cost breakdown by sub-region for the APAC energy and utility sectors, we notice that the Far East, excluding Japan, is exposed to the highest carbon price risk. In addition, the total apportioned unpriced carbon cost of this sub-region is even higher than the aggregate of the other four sub-regions. The energy and utility sectors in the Far East, excluding Japan, that rely heavily on conventional fossil fuels will face transition risk in the near future.
Combining CEaR and current GHG emissions intelligence can suggest deeper insights on climate change risk. For example, a high CEaR company with adequate disclosure is likely to have recognized its major emission sources, quantified the amount to reduce and determined what efforts are needed in the future. For those without disclosure, they must start with a more fundamental issue: how much emission reduction is necessary and which facilities are prioritized for the reduction?
Company Emission Trajectory Assessment: Paris Alignment
While CEaR suggests a company’s possible financial risk and the necessary efforts to consider for the future, reducing carbon emission in many sectors requires costly and time-consuming processes involving drastic changes in factories and production processes, or the exploration of new suppliers and materials. Achieving sufficient reductions while meeting current client expectations can be a very difficult task.
The Paris Alignment Dataset shows whether a company is aligned with the 20C target, or is well below it, based on its recent trends, and the direction it is taking. Even if the reduction has not yet fully appeared in the emissions data, a company may have started implementing adequate mitigation procedures, which is captured in the Paris Alignment Dataset's reduction target-based paths, as shown in Figure 6.
Figure 6: Carbon Emission Alignment for Company D and Company F
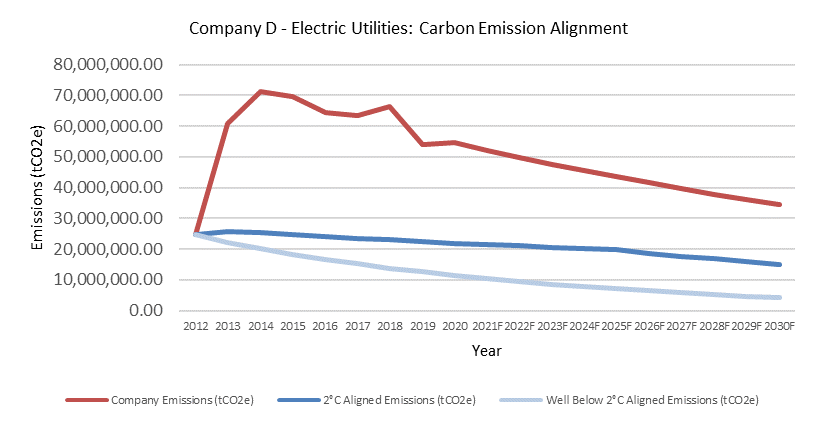
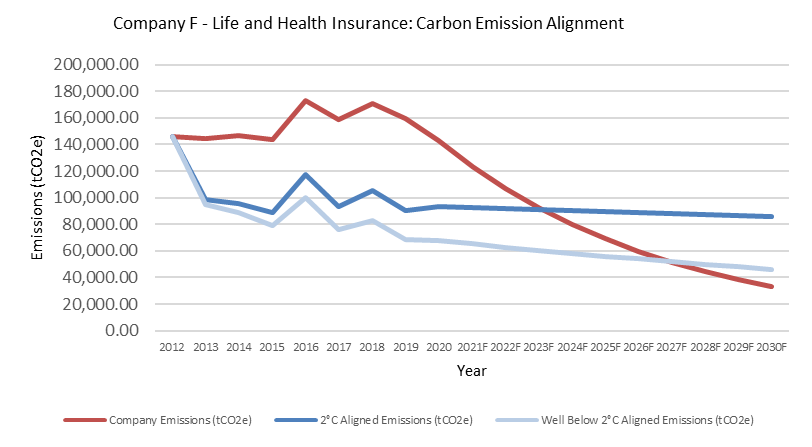
Source: S&P Global Trucost data from S&P Global Sustainable1 as of November 2022. Charts are for illustrative purposes only.
The transition pathway approach applied to assess the 20C alignment follows two methodologies recommended by the Science Based Targets initiative (SBTi): The Sectoral Decarbonization Approach (SDA) and the GHG Emission per unit of Value Added (GEVA). The SDA is normally applied to high-emitting sectors, such as steel, cement and power generation, since it considers the unique transition trajectory of these sectors. On the other hand, GEVA is employed to assess transition pathways of companies with diverse business activities by assuming these companies should reduce emissions consistent with the overall economy’s emission reduction rates. Comparing the projected pathways of sample companies D and F, assessed using SDA and GEVA, respectively, but incorporating their own reduction targets, it is obvious that Company D, an electric utility company, shows an alignment gap till 2030, although the gap keeps narrowing. Company F, a life and health insurance company, nearly achieves 20C alignment, but more reduction efforts are needed for both companies to achieve 1.50C alignment.
While the previous forward-looking data, CEaR, shows carbon risks based on a company's current emission conditions, Paris Alignment provides information on its current trend and progress. The combination of these two datasets can describe a company's carbon risk deeper and more precisely as shown in Table 2. Especially for high-risk companies denoted by CEaR, if a company has a specific target and shows a decreasing trend in emission intensity, its risk is still high, but is not likely to be in the worst category. On the contrary, if a high CEaR company does not show any progress or target, the future carbon risk could be the highest.
Table 2: Risk Assessment with Paris Alignment and Carbon Earnings at Risk Datasets
|
|
Paris Alignment |
||
|
Increasing or no change = no recognized efforts |
Decreasing trend = recognized efforts |
||
|
Carbon Earnings at Risk |
High = strong efforts required |
Highest Risk |
High Risk |
|
Low =moderate efforts required |
Low Risk |
Lowest Risk |
|
Source: S&P Global Trucost data from S&P Global Sustainable1 as of November 2022. Table is for illustrative purposes only.
Toward the Low Carbon Society
As this article was being prepared, the Cop27 Summit had just wrapped up. A landmark decision was made to fund vulnerable countries to cope with global warming, while most participants were concerned that the insufficient carbon reduction efforts will lead to a failure to meet the 1.50C target. S&P Global Sustainable1 is dedicated to providing solutions to help market participants fight and adapt to climate change. The three carbon-related datasets introduced here can help companies evaluate and disclose their carbon emission conditions and risks. Data users can effectively depict a company's real carbon performance and risk by combining all three.
Zero In On Your Net Zero.
Turn your net zero commitments into action with essential sustainability data and analytics. We’ll show you the numbers that add up to your net zero – and the steps you need to get there.
Get comprehensive carbon footprints that quantify GHG emissions across the entire global value chain. Learn more.
[1] Data as of January 2022.
Theme