Featured Topics
Featured Products
Events
S&P Global Offerings
Featured Topics
Featured Products
Events
S&P Global Offerings
Featured Topics
Featured Products
Events
S&P Global Offerings
Featured Topics
Featured Products
Events
Financial and Market intelligence
Fundamental & Alternative Datasets
Government & Defense
Banking & Capital Markets
Economy & Finance
Energy Transition & Sustainability
Technology & Innovation
Podcasts & Newsletters
Financial and Market intelligence
Fundamental & Alternative Datasets
Government & Defense
Banking & Capital Markets
Economy & Finance
Energy Transition & Sustainability
Technology & Innovation
Podcasts & Newsletters
30 Jan, 2017 | 10:30
Highlights
Assessment of which global industries set to benefit from Brexit using portfolio analytics and data from the S&P Capital IQ platform.
Britain’s Prime Minister Theresa May recently unveiled her 12-point strategy for the United Kingdom to negotiate its exit from the European Union. She signaled her ambition for the UK to strike free-trade deals with countries such as the US, or Asian nations such as Australia or India.
Using our standardised geographic segment data on our enhanced portfolio analytics platform, we are able to analyse the exposure of industries and companies in the S&P UK BMI index to North America and Asia in order to assess potential benefit - assuming trade with these nations gathers pace.
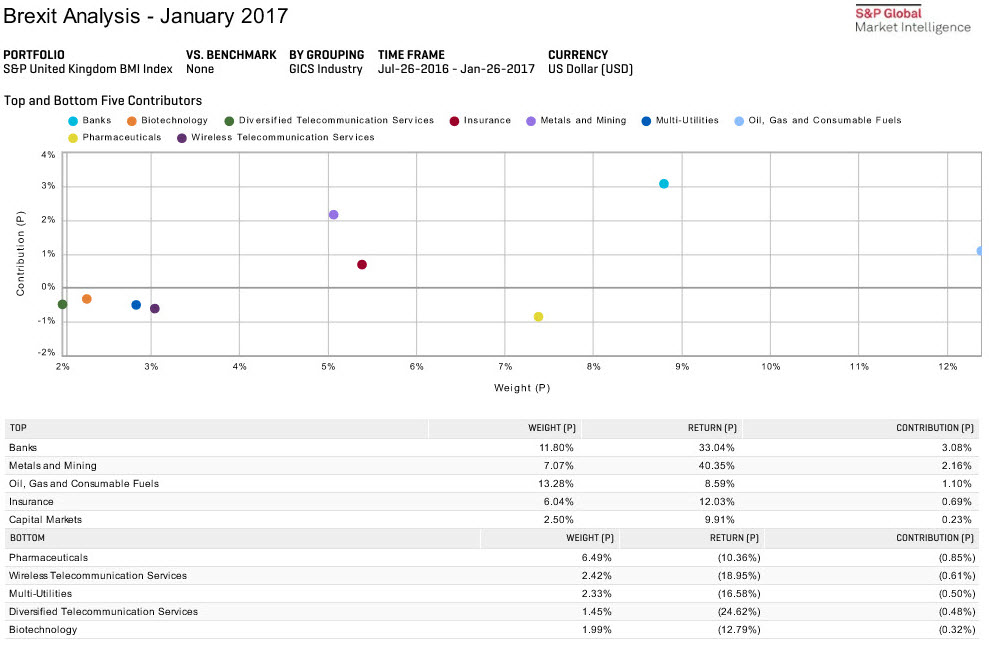
Companies in the S&P UK BMI index currently derive more than 20% of their revenue from North America and over 12% from Asia. A review of the index’s performance over the last six months after the Brexit vote, we observe a return just shy of 7% in local currency terms.
Grouped by industry, here are the top and bottom five contributors:
Chart 1. Top and Bottom 5 Performers Grouped by Industry
July 20, 2016 – January 19, 2017
Click to enlarge image.
Source: Portfolio Analytics, S&P Capital IQ platform as of January 19, 2017
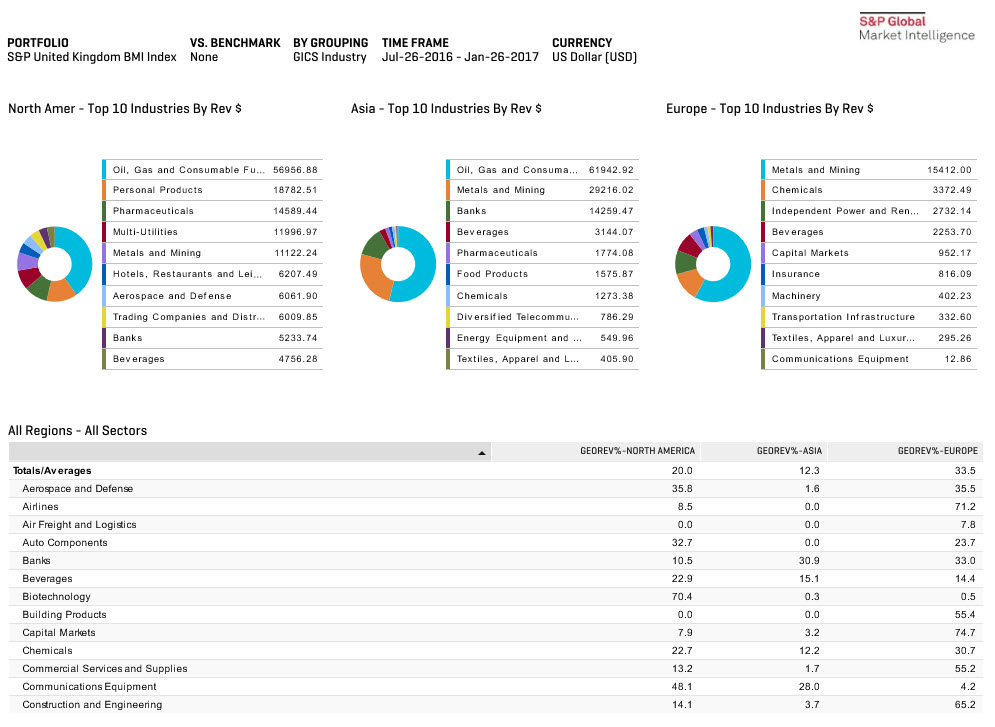
We are then able to look at the top ten industries that derived most of their latest fiscal year revenues from outside of Europe, specifically from North America and Asia, as well as their respective revenue % exposure for each region:
Chart 2. Top Ten Industries By Revenue (US$) For North America, Asia and Europe
July 20, 2016 – January 19, 2017
Click to enlarge image.
Source: Portfolio Analytics, S&P Capital IQ platform as of January 19, 2017
We first notice the top three industries for non-European revenue contribution shown in Chart 1 - Banks, Metals and Mining, and Oil, Gas, and Consumable Fuels, are also the top three industries with the largest portion of revenue derived from the Asia region, over the six-month period.
We can further study a single industry or company’s relative regional exposures. Here are some observations:
If President Trump keeps his promises to conclude a trade deal with the UK within two years, then some industries with low exposure to the US may start to enjoy greater success in this large market.
On the other side of the globe, faster trade with Asia, the fastest growth region in the world, may also be a boon for a number of industries and companies:
While we have used the S&P UK BMI Index, this analysis could also be performed for most major indices or an individual portfolio using our geographic segment data and portfolio analytics.
If you would like to run a specific analysis on your portfolio or selected indices, please contact us.
Notes on our GeoSegment Analytics:
Our GeoSegment data is collected by analysing the annual and quarterly filings from companies, organises and standardises the data disclosures into exposure by region, currency, or country. We then further enhance the coverage by looking at companies business segment filings and business descriptions. Our GeoSegment engine can usually achieve close to 90% mapping by region and over 50% mapping by country for over 11,600 public companies in the S&P Global BMI index family, into which the S&P United Kingdom BMI index is just one of the over 4000 sub-indices (Source S&P capital IQ, as of 19 January 2017).

