Featured Topics
Featured Products
Events
S&P Global Offerings
Featured Topics
Featured Products
Events
S&P Global Offerings
Featured Topics
Featured Products
Events
S&P Global Offerings
Featured Topics
Featured Products
Events
Financial and Market intelligence
Fundamental & Alternative Datasets
Government & Defense
Professional Services
Banking & Capital Markets
Economy & Finance
Energy Transition & Sustainability
Technology & Innovation
Podcasts & Newsletters
Financial and Market intelligence
Fundamental & Alternative Datasets
Government & Defense
Professional Services
Banking & Capital Markets
Economy & Finance
Energy Transition & Sustainability
Technology & Innovation
Podcasts & Newsletters
1 May, 2018
Metals & Mining
Highlights
Total copper exchange stocks at the end of March were at their highest level in over 10 years at 907,485 tonnes.
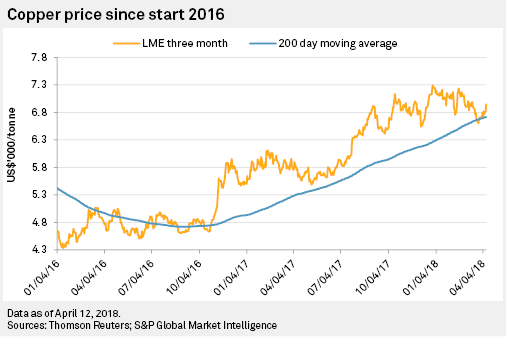
The price of copper fell March 26 to its lowest level since December 2017, and despite a slight recovery at the beginning of April, three-month copper prices are threatening to break below the 200-day moving average.
There are several indicators signaling a weaker copper market, and the latest issue of S&P Global Market Intelligence's Commodity Briefing Service noted that total copper exchange stocks at the end of March were at their highest level in over 10 years at 907,485 tonnes. As a result of this indication of ample copper availability, the differential price being paid for future metal deliveries, compared with immediate deliveries, widened for both close and further-dated spreads.
The contango (higher price) paid for three-month metal compared with cash metal rose to US$46/t on March 26, up from an average of US$34/t in February. The three- to 15-month contango increased to US$111/t, and the 15-month to 27-month spread widened to US$48/t.
Having started the year at 113,313 tonnes, managed money net long positions for copper on COMEX have virtually collapsed, retreating to just 2,975 tonnes March 27. We believe that this dramatic decline in bullish bets on copper by money managers is a sure signal of weakening sentiment for the metal.

We speak metals & mining. Learn more about our service.