Featured Topics
Featured Products
Events
S&P Global Offerings
Featured Topics
Featured Products
Events
S&P Global Offerings
Featured Topics
Featured Products
Events
S&P Global Offerings
Featured Topics
Featured Products
Events
Financial and Market intelligence
Fundamental & Alternative Datasets
Government & Defense
Banking & Capital Markets
Economy & Finance
Energy Transition & Sustainability
Technology & Innovation
Podcasts & Newsletters
Financial and Market intelligence
Fundamental & Alternative Datasets
Government & Defense
Banking & Capital Markets
Economy & Finance
Energy Transition & Sustainability
Technology & Innovation
Podcasts & Newsletters
ECONOMICS COMMENTARY — Feb 02, 2022
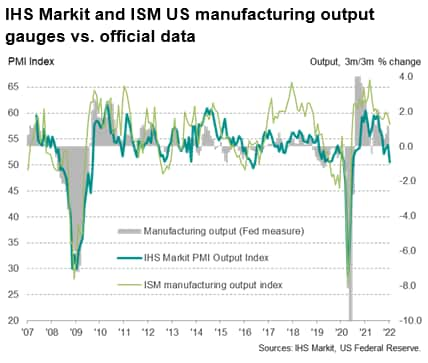
Both IHS Markit and ISM survey gauges showed the US manufacturing economy being hit by the surge in COVID-19 cases linked to the Omicron variant in January. However, the two surveys give markedly different pictures of the extent of the hit, with the ISM survey indicating a far less marked slowing than the IHS Markit index. The former has tended to overstate manufacturing performance in recent years, suggesting the IHS Markit index is providing a more accurate picture of a factory sector that is reeling under the disruptions caused by the latest virus wave.
The IHS Markit manufacturing PMI for January showed output growth deteriorating markedly. The sub-index covering production fell to 50.5 from 53.8 in December, its lowest since the recovery form the first COVID-19 lockdowns began in July 2020. The news was followed by the ISM survey's output gauge also falling, down to its lowest since June 2020. However, at 57.8 compared to 59.4 in December, the ISM index is still indicative of production rising at a substantial rate whereas the IHS Markit index is signalling almost no growth. For both surveys, any index reading above 50 means more companies reported higher output during the month than reported lower output.
While the signals form the surveys in terms of the direction of travel is clearly downwards, the extent of the slowdown and overall health of the goods producing sector being indicated is clearly very different.
To get an idea of why the ISM index is higher than the IHS Markit index we only have to look back at the survey history.
The ISM and IHS Markit gauges moved in similar cycles of similar magnitudes between 2007 and 2015, both serving equally well as accurate lead indicators of changes in the official data (charted here using the three-month-on-three-month rate of growth in the manufacturing component of industrial production, as this better captures the underlying trend in the official data than monthly percentage changes. To illustrate further, the ISM index averaged 54.5 between mid-2007 and the end of 2016 compared to an average IHS Markit reading of 53.2. These averages occurred over a period in which the average quarterly rate of growth of manufacturing output was -0.2% (and the average month-on-month change was +0.05%). Thus, both surveys therefore tend to have overstated performance to some degree over this period, averaging above 50 when output trended very slightly lower, though the ISM more so than the IHS Markit index.
Since 2016, however, the divergence has widened. The ISM output index has averaged 57.5 over the past six years while the IHS Markit index has averaged just 53.4. Yet over this period the average quarterly rate of change of manufacturing output has been just +0.1% (and the average month-on-month change was also +0.1%). The ISM index has therefore notably overstated growth relative to the official data to an increasing degree in recent years, contrasting with a more stable (and therefore more predictable) relationship of the IHS Markit data with the official growth rate.
These updated findings corroborate existing work from the legacy Macroeconomic Advisors team, which also found a statistical break between the ISM data and official industrial production numbers in 2017, with no such break evident in the IHS Markit numbers.
We remain uncertain as to what has caused the ISM survey to overstate official data, but it is clear that some allowance should be made by analysts when interpreting these survey data.
Updates can be received directly into your inbox by subscribing for free here.
Chris Williamson, Chief Business Economist, IHS Markit
Tel: +44 207 260 2329
chris.williamson@ihsmarkit.com
© 2022, IHS Markit Inc. All rights reserved. Reproduction in whole or in part without permission is prohibited.
Purchasing Managers' Index™ (PMI™) data are compiled by IHS Markit for more than 40 economies worldwide. The monthly data are derived from surveys of senior executives at private sector companies, and are available only via subscription. The PMI dataset features a headline number, which indicates the overall health of an economy, and sub-indices, which provide insights into other key economic drivers such as GDP, inflation, exports, capacity utilization, employment and inventories. The PMI data are used by financial and corporate professionals to better understand where economies and markets are headed, and to uncover opportunities.
This article was published by S&P Global Market Intelligence and not by S&P Global Ratings, which is a separately managed division of S&P Global.

