Featured Topics
Featured Products
Events
S&P Global Offerings
Featured Topics
Featured Products
Events
S&P Global Offerings
Featured Topics
Featured Products
Events
S&P Global Offerings
Featured Topics
Featured Products
Events
Financial and Market intelligence
Fundamental & Alternative Datasets
Government & Defense
Banking & Capital Markets
Economy & Finance
Energy Transition & Sustainability
Technology & Innovation
Podcasts & Newsletters
Financial and Market intelligence
Fundamental & Alternative Datasets
Government & Defense
Banking & Capital Markets
Economy & Finance
Energy Transition & Sustainability
Technology & Innovation
Podcasts & Newsletters
BLOG — Jul 14, 2021
Key points
Introduction
In the absence of international trade (autarky), a country can only consume what it produces. However, once the country opens up to international trade, it will specialize in producing and exporting certain goods (or variants of differentiated goods) in exchange for imports of foreign products (or other variants of differentiated goods). In line with the classic Ricardian tradition, countries specialize in producing goods with a comparative advantage. Comparative advantage can be defined as the ability to produce a given good at relatively lower costs than the competitors (or to be relatively more productive in producing certain commodities). Specialization in line with the comparative advantage should bring benefits to the country itself and globally, allowing the increase in global production and thus consumption.
Over time, the prosperity of a given state or a given region is determined primarily by the strength of its export base shaped by the evolving pattern of comparative advantages.
Comparative advantage and disadvantage concepts are used in international economics to identify sectors in which a country is stronger than its competitors and those in which it is weaker, meaning industries in which its relative costs of production are respectively lower and higher.
In the globalized economy, sectors with comparative advantage are expected to expand while those of comparative disadvantage are expected to shrink. As a result, the owners of assets and skills specific to thriving sectors gain, and those committed to deteriorating sectors lose.
Obviously, export specialization patterns of countries evolve due to dynamic changes in the underlying micro fundamentals, changing technologies, customer preferences, factor endowments, and changing sectors' and products' life cycles.
From the incoming recent micro-level data, we also know that the number or share of exporters within a sector (extensive margin of trade) is an increasing function of the comparative advantage of the given nation's sector vis-à-vis counterparts.
The existence of comparative advantage could thus be perceived as an indicator of the existence of a group of productive and internationally competitive firms able to penetrate international markets (able to cover sunk costs of entry and earn positive profits in global markets).
Despite heterogeneity between and within sectors, we know that exporters, on average, perform better than non-exporters, and export potential is usually concentrated in the group of the largest exporters (super-star exporters). This group and a group of firms close to reaching the exporter status are particularly interesting from the point of view of investments banks and funds as they could potentially bring above-average returns.
Export specialization in East Asia
In the present article, we analyze the evolution of export specialization of three East Asia economies: China (mainland), South Korea and Japan, over 2000-2020. We also, in some element, provide the reference to the U.S. considered to be on the global technology frontier (GTF).
In the process, we are utilizing the export specialization dashboard of IHS Markit, which will soon become a new feature available to clients of our Global Trade Analytics Suite in the GTA Forecasting Analytics section.
We note that the export specialization of countries of the regions changes over time, with the most significant changes present in China (mainland) followed by South Korea. The changes observed seem to be in line with the FG paradigm described in the preceding section.
Case study - Changing pattern of export specialization of China (mainland) in 2000 & 2020
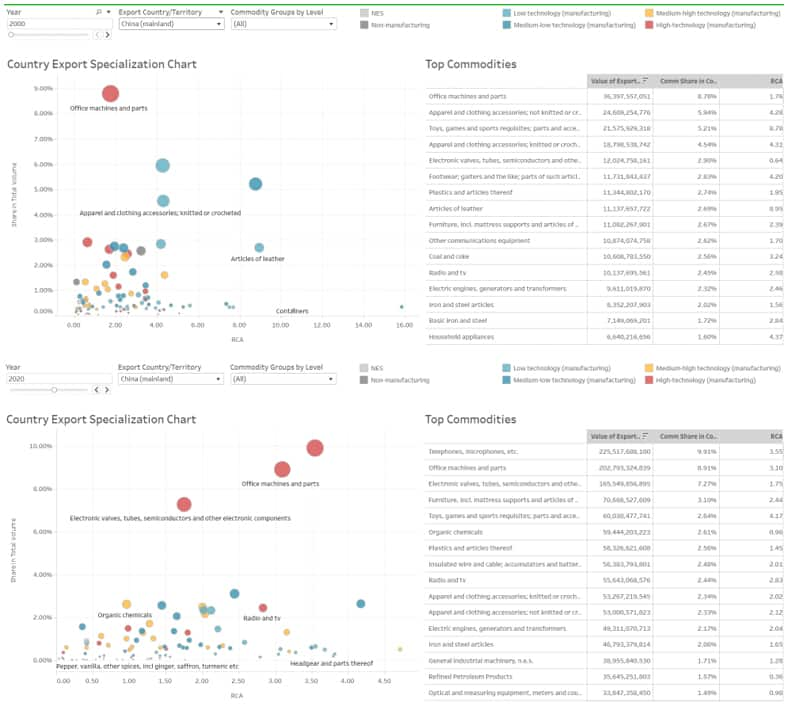
Source: IHS Markit GTA Forecasting export specialization dashboard (© 2021 IHS Markit)
As a further illustration, we show information from the benchmarking tab of our new export specialization dashboard displaying the evolution of the value of export and RCA indices for electronic components (including semiconductors) for Japan and China (mainland) over 2000-2020. It indicates the convergence of China to the GTF and subsequently becoming the foremost global exporter of these parts (overtaking Japan in terms of value already in 2008). In 2000, the leading exporters were the U.S., Taiwan, Japan, South Korea and Malaysia. In 2020, the top global exporters were China (mainland), Taiwan, South Korea, Malaysia, Japan, the U.S., Vietnam and Singapore, China (mainland), exporting more than twice more than South Korea and more than three times more than Japan.
Case study - Dynamic specialization benchmarking of China (mainland) & Japan in production of electronic components
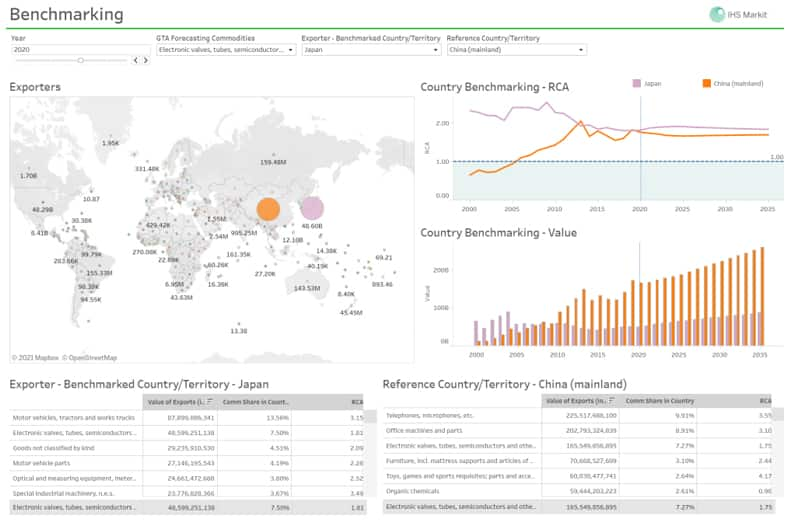
Source: IHS Markit GTA Forecasting export specialization dashboard (© 2021 IHS Markit)
Trade similarity in the East Asia region
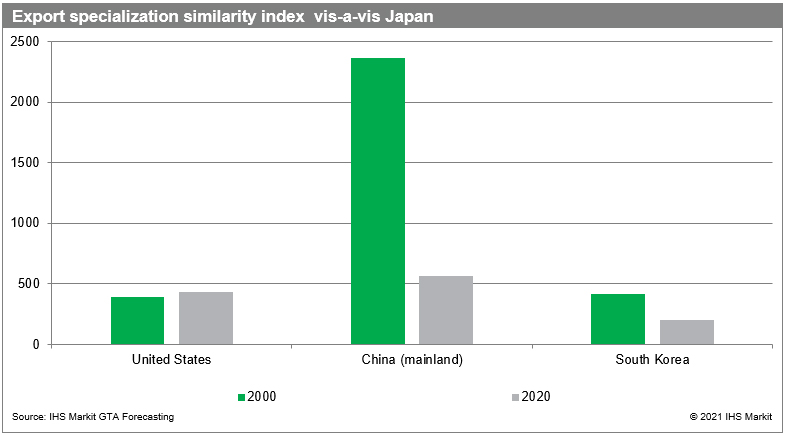
Taking into account commodity level RCA values for analyzed countries in 2000 and 2020, we calculated the trade similarity index vis-à-vis Japan treated as a reference country. The trade similarity was calculated as a sum of squared differences in RCA of a given country vis-à-vis Japan, with values closer to zero indicating greater similarity.
In 2000, the index values were equal to 416 for South Korea and 2360 for China (mainland). In 2020 the values were equal to 203 and 566. Therefore, looking from an export specialization perspective, both South Korea and China (mainland) are gradually becoming more similar to Japan over time, with the speed of the process faster for China mainland.
With increasing similarity, we could observe greater competition between companies from the three states in the international markets, potentially greater extent of intra-sectoral specialization (both horizontal & vertical type), and more elaborated regional value chains.
The establishment of RCEP could speed up the process.
It is also interesting to compare Japan to the other country on the global technology frontier (U.S.). U.S. export pattern was more similar to Japanese in 2000 than South Korea and China. Trade similarity decreased to 2020 but not significantly (434). The U.S. was overtaken by South Korea in export pattern similarity to Japan, with China not very far off at this stage as well.
Evolving technological sophistication
It is interesting to look at the product specialization of the analyzed countries from the point of view of technological sophistication. We utilize the standard OECD/EC classification into high-technology, medium-high technology, medium-low technology and low-technology sectors by mapping the GTA Forecasting commodities to NACE sectors. The classification is based on the R&D intensity of industries - the share of R&D expenditures in total sales.
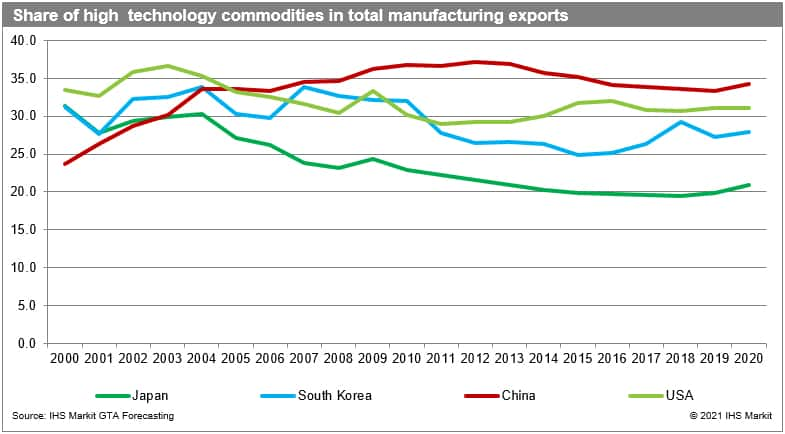
Overall, Japan has the highest share of high and medium-high technology goods in the structure of its exports. It constantly exceeds the share in the reference country (United States). The shares are rising in South Korea and China, which is converging to the global technology frontier and in line with the FG model of development.

If we focus on high-technology goods, only China has the highest share of high-tech goods in manufacturing exports from 2005 onwards vis-à-vis both of the benchmark group states and the U.S. (34.3% in 2020, in comparison to 31.0% in the U.S., 27.9% in South Korea and only 20.9% in Japan). Obviously, to draw the correct conclusion, we would also have to consider the origin of exporters producing in each of the states, with a large number of foreign-owned high-technology companies or the Chinese subsidiaries responsible for the result China (mainland).
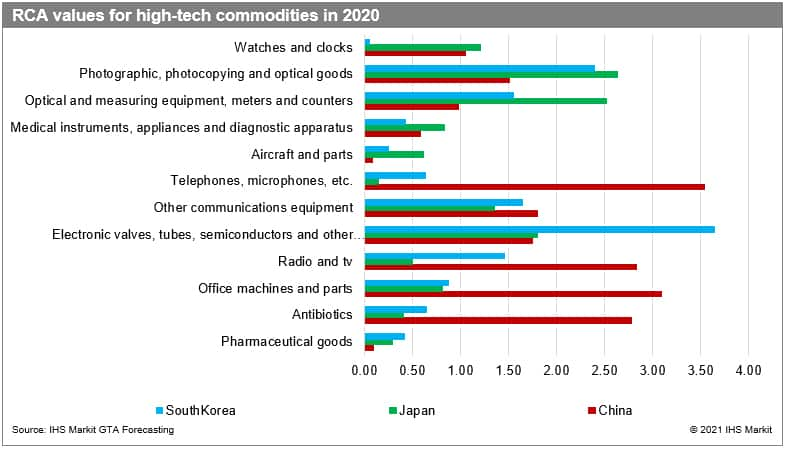
Among high-tech commodities, relative to the world average, South Korea specialized the most in exports in 2020 in electronic components (RCA 3.65), photographic, photocopying, and optical goods (2.40), and other communication equipment (1.65). Japan had the strongest position in photographic and optical goods (2.64), followed by optical and measuring equipment (2.52) as well as electronic components (1.81) and other communication equipment (1.35) and watches (1.21). China, in turn, enjoyed the highest specialization in exports from a global perspective in telephones (3.55), office machines & their parts (3.10), radio and TV equipment (2.83), antibiotics (2.79), other communications equipment (1.80), and electronic components. (1.75). The overlaying pattern of specialization of countries can indicate the existence of regional value chains.
Flying geese model
The "flying geese" is frequently applied to the context of development in East Asia. Developed by Akamatsu back in the 1930s, the model postulates a sequential development or catching up process of manufacturing industries in developing countries (Akamatsu 1962). The initial idea of Akamatsu has been further developed (e.g., Ozawa 1993, Kojima 2000). The modern version of the FG paradigm postulates a sequential transformation of economic activities from industrialized to less-industrialized economies through trade and the increasing role of MNEs (through, among others, sub-contracting, licensing agreements, joint ventures, FDI flows) in association with the gradual evolution in comparative advantage patterns in production and exports. A specific associated hierarchy of economies develops.
Japan being initially the East Asia region's most technologically advanced country and becoming initially the region's leading trading global partner and the source of FDI for the other East Asian countries, played a pivotal role in the East Asian economic development (leading goose). Through international product - and industry-cycle sequencing, the process led to technological upgrading of the newly industrializing economies in the region and further the ASEAN group and finally China, when it embarked on market reforms and subsequent economic expansion.
In the process, the ongoing cycle of development of industries and changing factors and technological endowments affect the country's comparative advantage. It also means that the economy changes its production activities (and export) from the lower value-added, more labor-intensive, and less capital-intensive industries to the higher value-added, less labor-intensive, and more capital-intensive sectors. In the present phase of global development, the model should naturally extend to encompass increasing role of knowledge, skills (and skill-biased technological change), particular modern business services sectors (nearshoring of KIBS), and thus the development of more complex regionalized value-chains.
For instance, Ginzburg & Simonazzi (2005) found that the evolution of the electronic industry in the East Asia region consisted of the FG model. They also pointed to a trend towards reducing the comparative advantage of Japan in favor of the newly industrialized states and/or the ASEAN group.
The technological convergence can be observed by the analysis of the evolution of shares of products in countries' exports, or this dynamic specialization can be followed by an analysis of the evolution of RCA indices over time for a specified group of countries (this is the feature provided in our new Global Trade Analytics Suite dashboard) allowing for dynamic benchmarking of reporters.
Revealed comparative advantage
The revealed comparative advantage (RCA) is an index used in empirical international economics/trade analysis for calculating the relative advantage or disadvantage of a particular country in a specific class of goods or services as evidenced by trade flows. It is based on the classic concept of Ricardian comparative advantage. It most commonly refers to an index, called the Balassa index, after Balassa (1965).
RCA's measure competitiveness across products and thus reflects macro and trade policies and differences in technology and factor endowments.
The index in its simplest form is calculated as a ratio of the share of a given product group in exports of a given country to a share of a given product group in the world's exports (treated as a point of reference or a natural benchmark). The values of RCA above 1.0 indicate a comparative advantage in a given product group in a year. It can be analyzed statically or dynamically (changes in RCA). If RCA is less than unity, the country is said to have a comparative disadvantage in the commodity or industry.
In dynamic use, it can indicate changes in the competitiveness of countries in the product space (upgrading or downgrading). The underlying objective is to figure out which products are likely to be the next to move up on the ladder of comparative advantage.
Subscribe to our monthly newsletter and stay up-to-date with our latest analytics
References
Akamatsu, K. (1962). A historical pattern of economic growth in developing countries. The developing economies, 1, 3-25.
Balassa, B. (1965). Tariff protection in industrial countries: an evaluation. Journal of Political Economy, 73(6), 573-594.
Ginzburg, A., & Simonazzi, A. (2005). Patterns of industrialization and the flying geese model: the case of electronics in East Asia. Journal of Asian Economics, 15(6), 1051-1078.
Kojima, K. (2000). The "flying geese" model of Asian economic development: origin, theoretical extensions, and regional policy implications. Journal of Asian Economics, 11(4), 375-401.
How can our products help you?