Featured Topics
Featured Products
Events
S&P Global Offerings
Featured Topics
Featured Products
Events
S&P Global Offerings
Featured Topics
Featured Products
Events
S&P Global Offerings
Featured Topics
Featured Products
Events
Financial and Market intelligence
Fundamental & Alternative Datasets
Government & Defense
Banking & Capital Markets
Economy & Finance
Energy Transition & Sustainability
Technology & Innovation
Podcasts & Newsletters
Financial and Market intelligence
Fundamental & Alternative Datasets
Government & Defense
Banking & Capital Markets
Economy & Finance
Energy Transition & Sustainability
Technology & Innovation
Podcasts & Newsletters
ECONOMICS COMMENTARY — Feb 16, 2021
Key points for January 2021:
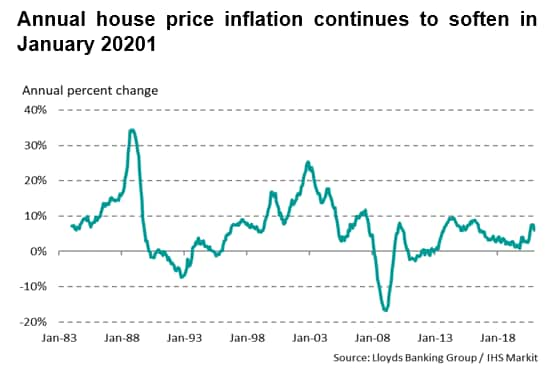
January's Halifax House Price Index (HHPI) provided fresh evidence that the 2020 upturn in the housing market is running out of steam with prices falling at the start of the year and the annual rate of inflation weakening to its lowest recorded level for five months.
Since December prices slipped by -0.3%, pushing the standardised house value down to its lowest level since October. Nonetheless, at just under £252,000, typical values remain close to November's record. Moreover, prices are still up around £13,000 compared to a year ago (or, in percentage terms, 5.3%).
A Year in Review: 2020
January's HHPI data are the first of the new year and follow on from a tumultuous 2020 when the market experienced three distinct phases of varying activity.
Firstly, buyers enjoyed the positive momentum gained from the clarity at the start of the year of both the Conservative Party's general election win in December 2019 and (at the time) Brexit.
However, the strong start to the year in terms of both activity and price developments was punctured by the first national lockdown imposed to slow the spread of COVID-19. This placed the economy, and with it the housing market, into effective deep freeze. Transaction volumes were approximately 80% lower than typical during this period.
When the first lockdown was lifted in late May and market activity could resume - and much to the surprise of many commentators who predicted rapid declines in prices - there was a noticeable shift in property preferences, with stronger demand amongst buyers for greater space in lower population density areas.
With a stamp duty holiday effectively supercharging the market, in the second half of the year mortgage transaction numbers reached their highest levels since before the financial crisis in 2008/2009.

House Price Indices: Timeliness and Revisions
These rapid shifts in market activity inevitably led to considerable challenges for all producers of house price indices throughout 2020, including Nationwide and the Office for National Statistics (ONS), who both use a similar mixed adjustment hedonic regression technique as the Halifax HPI.
However, a key difference between the indices produced by the mortgage providers and the ONS is that the latter's figures are based on actual property completions. In contrast, the Halifax HPI is derived from mortgage approval data from Lloyds Banking Group, the biggest provider of mortgage funds in the UK.
This difference in data availability has been key in ensuring that the Halifax HPI has been successfully able to produce key market price information in a timely, stable, and a consistent manner.
Although completions data provide a broader measurement of the housing market by, for instance, including non-mortgage transactions, often such information can take many weeks to become available. For new houses, challenges are even more acute, with new entries generally taking longer to appear on the land register than existing houses.
This leads to two immediate challenges for the ONS House Price Index.
Firstly, ONS data releases will inevitably lag those produced by mortgage providers who can utilise their data in 'real-time'. Indeed, the Halifax HPI is released for a complete calendar month just five working days after the end of that period. [*]
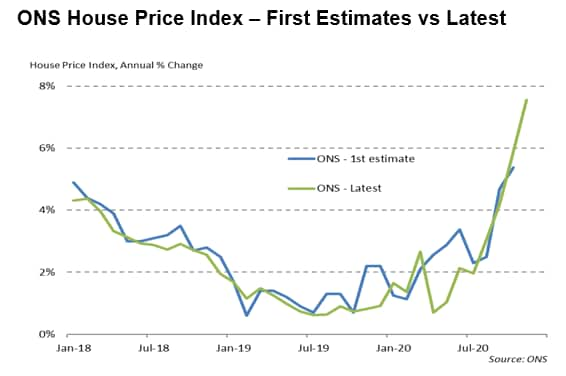
Secondly, the ever-evolving completions data means that initial ONS estimates, which are already released with around a two-month lag compared to the Halifax HPI, will inevitably be revised - and may continue to change for several months after a reference period.
The chart below provides a visual of these revisions on the annual percent change of the ONS House Price Index during the past three years.

The effect of the pandemic on the ONS index is clear, with the difference between the first and latest estimates in the 2020 data much greater than during the previous two years. For 2018-2019, the average difference between initial and latest estimates in absolute terms is around 0.4ppts. Between January and October of 2020, that number jumps to 0.8ppts.
There is subsequently a trade-off for users between having data that released with a delay and subject to revision but based on market completeness, versus the timing advantage afforded by the Halifax HPI.
And at times of rapid market change such as those seen over the past year, noticeable delays in publication and, for a period between May and August 2020 the actual suspension of the ONS series, the timing advantage afforded to policymakers and institutions that use these indices is invaluable.
Historical Comparisons
Whilst in theory the wider market coverage of the ONS indices provides an advantage in the estimation of house prices compared to the Halifax HPI, any differences between the two in actual price trends have proven to be negligible over time.
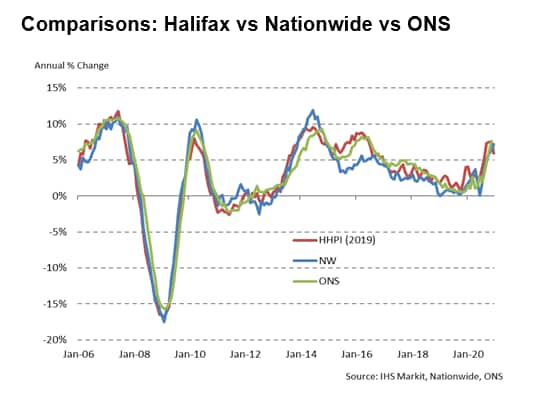
The chart below tracks historical annual price changes for the three major providers of house price indices that use hedonic regression techniques.

All three indices exhibit close relationships, successfully capturing all the major peaks and troughs in annual price changes since 2006. There is only one period of noticeable divergence, that being the underestimation of house price inflation by Nationwide in the run-up to the 2016 changes in stamp duty rules for buy-to-let and second homeowners.
An estimate of the mutual relationship between the Halifax HPI and the ONS series as provided by a correlation statistic is over 96%, an extremely positive result. That said, there appears recently to have been a slight shift in the 'lead' of the Halifax HPI, with inflation rates of over 7% only just reported by the ONS for November - compared to similar figures being reported by the Halifax HPI in September.
This likely reflects the delays in completions data coming through to the ONS index compared to mortgage approvals, a timing difference that has likely been exacerbated by recent reports of delays in the conveyancing process.
Outlook for 2021
Looking ahead to 2021, it is perhaps a little early to call a market peak - generally a longer sequence of falls is needed to be more definitive - but there is a distinct feeling of moving into such territory given prevailing market conditions and upcoming tax/incentive changes.
Indeed, the stamp duty holiday that began last year undoubtedly helped to fuel already rising demand amongst households for larger properties. And such was the surge in sales (as noted above) there has been a noticeable increase in conveyancing times, making the finalisation of house moves a lot lengthier than usual.
This suggests that agreed transactions in the early part of 2021 are likely to be (or should be) pricing in the return of stamp duty charges at the start of April.
And with the Help to Buy programme also slated to undergo substantial changes at the end of March, it's hard to see past what seems to be an upcoming period of downward pressure on prices.
How far and how deep any slowdown proves to be is a challenge given the prevailing uncertainty created by the pandemic across all elements of economic forecasting.
But with swathes of the economy still shuttered, and joblessness continuing to edge higher - especially amongst younger buyers - on the surface this again points to slower market activity and declining or stagnant prices in the near-term.
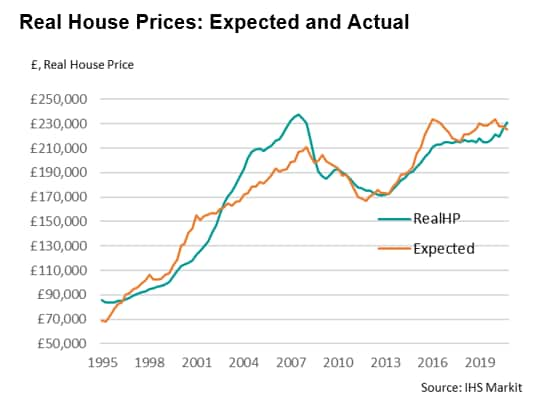
Moreover, using a simple model based on income, real house prices appear to be around 2%-3% "overvalued" i.e. the typical price being paid is a little higher than should be the case based purely on income fundamentals. Whilst by no means a considerable overvaluation - the chart below highlights periods of much greater mismatches between selling prices and expected values such as in the run up to the financial crisis - this does add to the view of another source of mild downward pressure on house prices, all things equal.

Nonetheless, given the power of homemovers looking to find new properties with greater space to drive the market in the second-half of last year- indeed our recent research has shown higher prices and activity for larger properties and for those in rural locations - structural demand changes arising from emerging trends such as more working from home, could sustain underlying market activity for some time to come.
Given the prevailing uncertainty and evolving macroeconomic conditions, 2021 is therefore set to be another interesting year for the housing market.
The best way to keep up to date with price developments will to be watch closely the Halifax HPI: UK wide data are always released on the fifth working day of the month, with detailed monthly regional figures following on the eighth working day.
Finally, for further information and subscription details please email economics@ihsmarkit.com
Paul Smith, Economics Director, IHS Markit
Tel: +44 1491 461038
paul.smith@ihsmarkit.com
© 2021, IHS Markit Inc. All rights reserved. Reproduction in whole or in part without permission is prohibited.
Posted 16 February 2021 by Paul Smith, Ph.D., Director, Economic Indices, S&P Global Market Intelligence
Purchasing Managers' Index™ (PMI™) data are compiled by IHS Markit for more than 40 economies worldwide. The monthly data are derived from surveys of senior executives at private sector companies, and are available only via subscription. The PMI dataset features a headline number, which indicates the overall health of an economy, and sub-indices, which provide insights into other key economic drivers such as GDP, inflation, exports, capacity utilization, employment and inventories. The PMI data are used by financial and corporate professionals to better understand where economies and markets are headed, and to uncover opportunities.
This article was published by S&P Global Market Intelligence and not by S&P Global Ratings, which is a separately managed division of S&P Global.
Location
