Featured Topics
Featured Products
Events
S&P Global Offerings
Featured Topics
Featured Products
Events
S&P Global Offerings
Featured Topics
Featured Products
Events
S&P Global Offerings
Featured Topics
Featured Products
Events
Financial and Market intelligence
Fundamental & Alternative Datasets
Government & Defense
Banking & Capital Markets
Economy & Finance
Energy Transition & Sustainability
Technology & Innovation
Podcasts & Newsletters
Financial and Market intelligence
Fundamental & Alternative Datasets
Government & Defense
Banking & Capital Markets
Economy & Finance
Energy Transition & Sustainability
Technology & Innovation
Podcasts & Newsletters
EQUITIES COMMENTARY — Feb 12, 2021

By Sam Pierson
A well-known use for US equity finance data is the estimation of the Short Interest published by US exchanges in between the bi-monthly publications of that dataset. This can be done effectively and result in a timeliness and level of insight unavailable from the Exchange Short Interest (SI) data alone. There are important considerations when applying these methods, which we'll discuss here. These considerations are critical for market participants, highlighted by the January short squeeze when a demand for real-time insights faced the real-world challenge of providing them. Estimating Exchange SI with a model has advantages and drawbacks which are revealed by reviewing the model output in the context of the inputs.
The bi-monthly Exchange SI publications show the gross short positions across underlying accounts held with FINRA member broker-dealers. The disclosures are aggregated and made available after the close on the 7th trading following the settlement date they were collected for. The January 29th short interest dataset was published by US exchanges after the close on February 9th. Since the dataset was collected for January 29th settlement, it reflects settled open short positions held from trade date January 27th.

Equity finance data including the number of shares on loan, is also published for a settlement date and reflects the trade date two days prior. This brings in an essential consideration for estimating the short interest: the number of Shares on Loan, as published by IHS Markit Securities Finance, can be considered the net borrow demand beyond broker-dealers' internal supply of shares.
When a short sale is made, the broker settling the trade can either borrow shares from an external counterparty (picked up in the equity finance dataset) or they can use shares already in their custody for delivery to the counterparty who made the purchase from the short seller. For Prime Brokers (PB), who handle most short sales, the key sources of internal supply are hedge fund longs (which may be in margin or fully paid accounts) and Delta-1 long positions. The gap between the short interest and shares on loan can generally be interpreted as the internal supply the brokers held in custody and delivered to settle short sales.
The management of dynamic internal supply means that brokers will modify their borrowing both to reflect changes in client short positions and to reflect changes in their own internal availability. They may also modify their usage of internal supply in anticipation of supply or demand changes, which is why shares on loan may react to an event on trade date or T+1. This creates a challenge for estimating the short interest in real-time based on shares on loan, because it's possible that a decrease in borrowing reflects an increase in internal availability as opposed to a decrease in short positioning.
To deal with share borrowing changes potentially being driven by variations in broker-dealer longs, a model which estimates the short interest needs to qualify the changes in shares on loan by estimating the probability that they reflect a change in short interest. The SI Forecast from IHS Markit does this partly by looking at the historical relationship between the short interest and shares on loan. The goal is to correctly forecast changes with a minimum of error introduced by forecasting large changes that don't materialize. For that reason, the SI Forecast incorporates the most recently published Exchange SI data and subsequently adjusts based on model inputs including shares on loan. The forecast is unlikely to fully reflect a change in shares on loan unless the two series are very similar historically, which suggests a minimal Prime Broker internal availability.
GameStop Example:
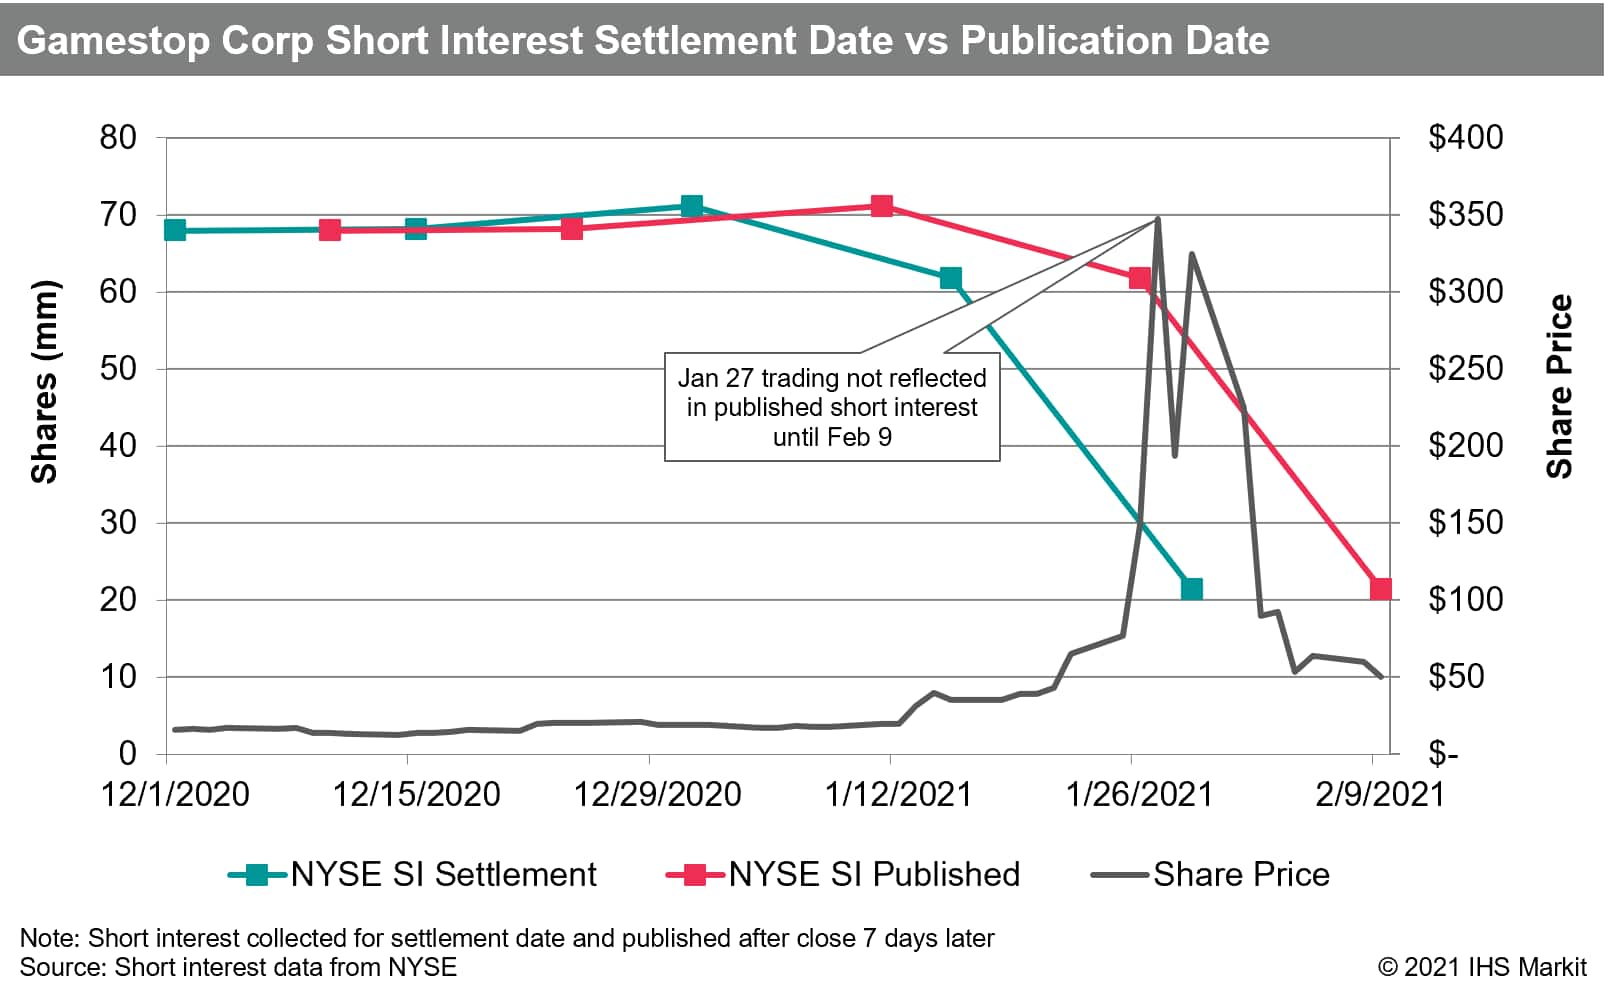
The January 15th NYSE Short Interest dataset showed 61m shares short for GameStop, a 9.4m share decline since the December 31st publish. The January 15th dataset was published after the close on January 27th. The timeline is important to note because during the trading sessions from January 22nd to 27th, when the share price increased from $65 to $347, the most recently available NYSE SI data was the December 31st observation, which showed 71m shares short.

GameStop Shares on Loan was published by IHS Markit as 51m shares for January 15th, 9.4m shares lower than the NYSE SI for Jan 15 settlement. The January 15th equity finance dataset was published on Jan 18 (S+1, with a weekend). By January 27th, when the January 15th short interest was published, the most recently published equity finance dataset was Jan 26th, which showed 41.7m shares on loan, a 9.3m share reduction since Jan 15th.

From the perspective of post-close January 27th, market participants knew that the short interest for Jan 15 was 61.8m shares, which declined by 9.4m shares since Dec 31st. The Jan 26th shares on loan showed a decline of 9.3m shares as compared with Jan 15th; if that were fully reflected in a reduction in short interest, that would mean 52.5m shares short on Jan 27th.
The first SI forecast published by IHS Markit which reflected knowledge of Jan 15th SI was for the Jan 27th dataset. That was published on Jan 28th and estimated the short interest at 56.4m shares. The forecast was heading in the direction of assuming the change in shares on loan was the change in short interest (52.5m shares), however, the model gave a lower weighting to the equity finance data and was nearly 4m shares higher for that reason.

Over the final days of January, the Shares on Loan continued to decline. From the perspective of February 1st, when the Jan 29th equity finance dataset had been published, there were only 17.4m shares on loan, reflecting a 31.5m share reduction in shares on loan between Jan 15th - 29th. The most recent short interest was still Jan 15th at 61.7m shares, so if the change in shares on loan were fully reflected, that would mean 30m shares short. The SI forecast published on Feb 1st estimated 50m shares short.
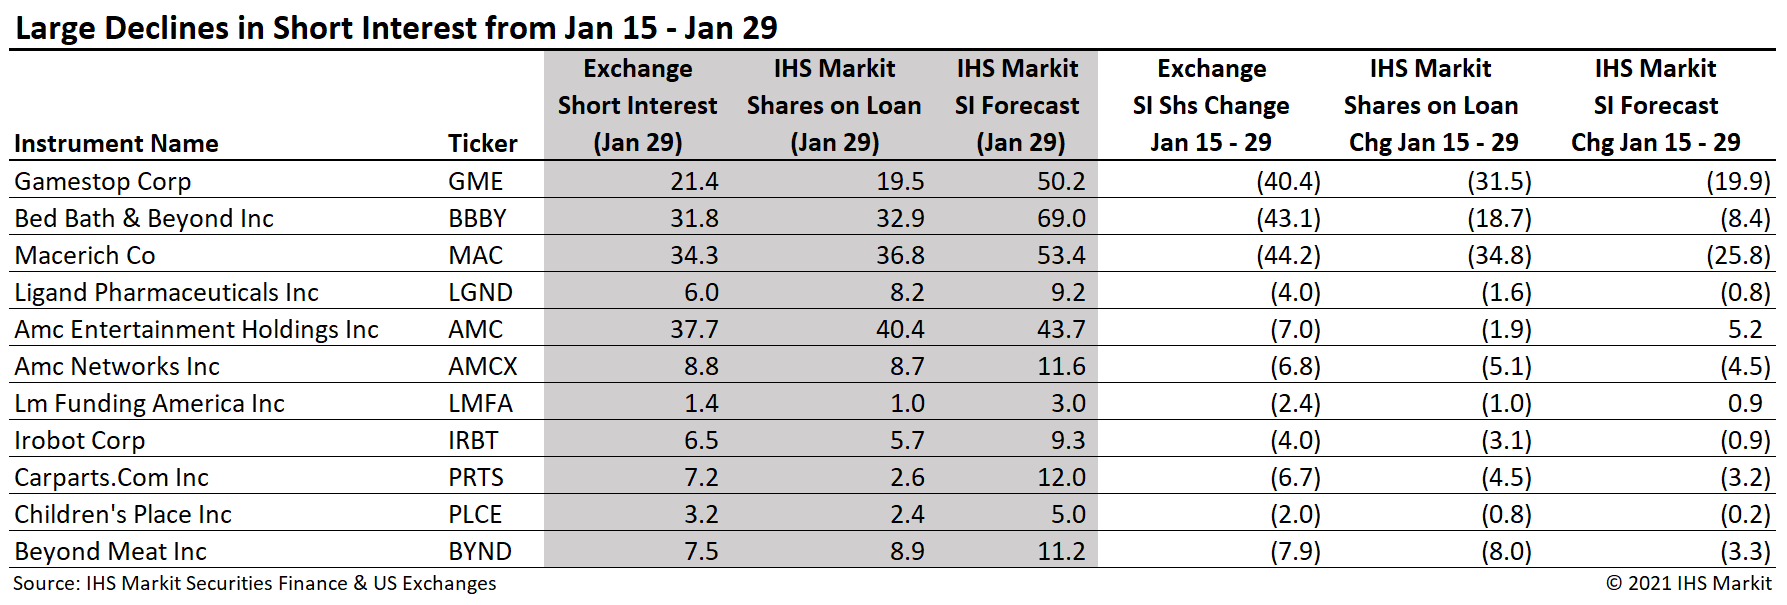
On February 9th, the short interest dataset for Jan 29th settlement was published, which showed that short interest had declined by 40m shares to 21.4m shares. The gap between the shares on loan and short interest declined from 10.7m shares on Jan 15th to 1.9m shares on Jan 29. The declining gap indicated the possibility that hedge fund longs who had previously lent their shares (in so doing reducing the need for their brokers to borrow shares externally for client shorts) had recalled their shares over the last two weeks of January, forcing a larger portion of the total short position to be settled with shares borrowed from the equity finance channel. The Jan 29th settlement pertains to Jan 27th trade date, which means the vast majority of the short position had been covered by trade date Jan 27th.
The question may then be asked: Why bother with the forecast? The purpose of the forecast is to provide a daily estimate of the Exchange Short Interest which will be as close as possible to the as-yet unpublished Short Interest figure. The previous publication of that figure will, in general, be reasonably close, so the assumption of no-change will yield a result that appears accurate in comparison to a specific date, but obviously does nothing to track changes between publishes. There is a persistent correlation between the shares on loan and short interest for many US equities, so using the shares on loan in a model makes sense; however, there are known causes for the series to diverge (changes in broker-dealer internal availability). Any suggestion of change from the prior short interest has the potential to introduce error, so a substantial recognition of changes in shares on loan should only be done when the two series are highly correlated, grading slowly toward a very limited reliance on equity finance data where there is a low expectation for forecasting success. In this view, the forecast performed as expected with the inputs available. It would have been possible for the Jan 29 short interest to print at 50m shares, which would have been interpreted as a substantial uptick in dealer inventory, likely the result of an increase in hedge fund longs (possibly also some index related Delta-1 longs). Given the events which unfolded over the last week of January, along with the decline in shares on loan, that may have been deemed unlikely, but is important not to discount as a possibility when considering the model output.
Conclusion:
The Exchange Short Interest publish is a valuable source of data which is widely used. When the phrase "Short Interest" is used pertaining to US equities it is understood to mean the bi-monthly figures. One important caveat is that Exchange Short Interest only includes short positions cleared by FINRA member broker-dealer entities, which means it is possible short positions not to be included. While the knowledge that the short interest data is not comprehensive is important, there narrative impact from the common knowledge of short interest may be more significant than ever. The reporting lag and the lag to trade date mean that the shortest time between a short sale being traded and included in the SI dataset is ten trading days. On the eve of an SI release, the prior publish is more than three weeks old. Equity finance data can help identify short flows between publishes, and the comparison reveals other signals; however, it is no panacea. Using a model to estimate short interest can be helpful but introduces a new source of error and should therefore, when precision is required, be considered in the context of model inputs.
Suggested further reading:
S&P Global provides industry-leading data, software and technology platforms and managed services to tackle some of the most difficult challenges in financial markets. We help our customers better understand complicated markets, reduce risk, operate more efficiently and comply with financial regulation.
This article was published by S&P Global Market Intelligence and not by S&P Global Ratings, which is a separately managed division of S&P Global.