Featured Topics
Featured Products
Events
S&P Global Offerings
Featured Topics
Featured Products
Events
S&P Global Offerings
Featured Topics
Featured Products
Events
S&P Global Offerings
Featured Topics
Featured Products
Events
Financial and Market intelligence
Fundamental & Alternative Datasets
Government & Defense
Banking & Capital Markets
Economy & Finance
Energy Transition & Sustainability
Technology & Innovation
Podcasts & Newsletters
Financial and Market intelligence
Fundamental & Alternative Datasets
Government & Defense
Banking & Capital Markets
Economy & Finance
Energy Transition & Sustainability
Technology & Innovation
Podcasts & Newsletters
EQUITIES COMMENTARY — Sep 21, 2021
Research Signals - September 2021
With the summer months winding down in what is typically a quiet period for equity markets, US stocks notched new highs in mid September before experiencing a sell off on 20 September. Investors returning from vacation now grapple with potential threats to the economic recovery ranging from rising delta variant cases, tapering of Federal Reserve bond purchases, increasing taxes, intensifying geopolitical risks and, most recently, roiling Chinese credit markets and fears of contagion from Evergrande's debt crisis. With these pressures in mind, we review several signals identifying various headwinds facing sectors.
We set the stage with a review of various segments of the market, including large and small caps and value and growth stocks. We use the iShares Russell 1000 ETF (IWB), iShares Russell 2000 ETF (IWM), iShares Russell 1000 Growth ETF (IWF) and iShares Russell 1000 Value ETF (IWD), respectively, sourced from the IHS Markit ETF Analytics database, to represent each theme.
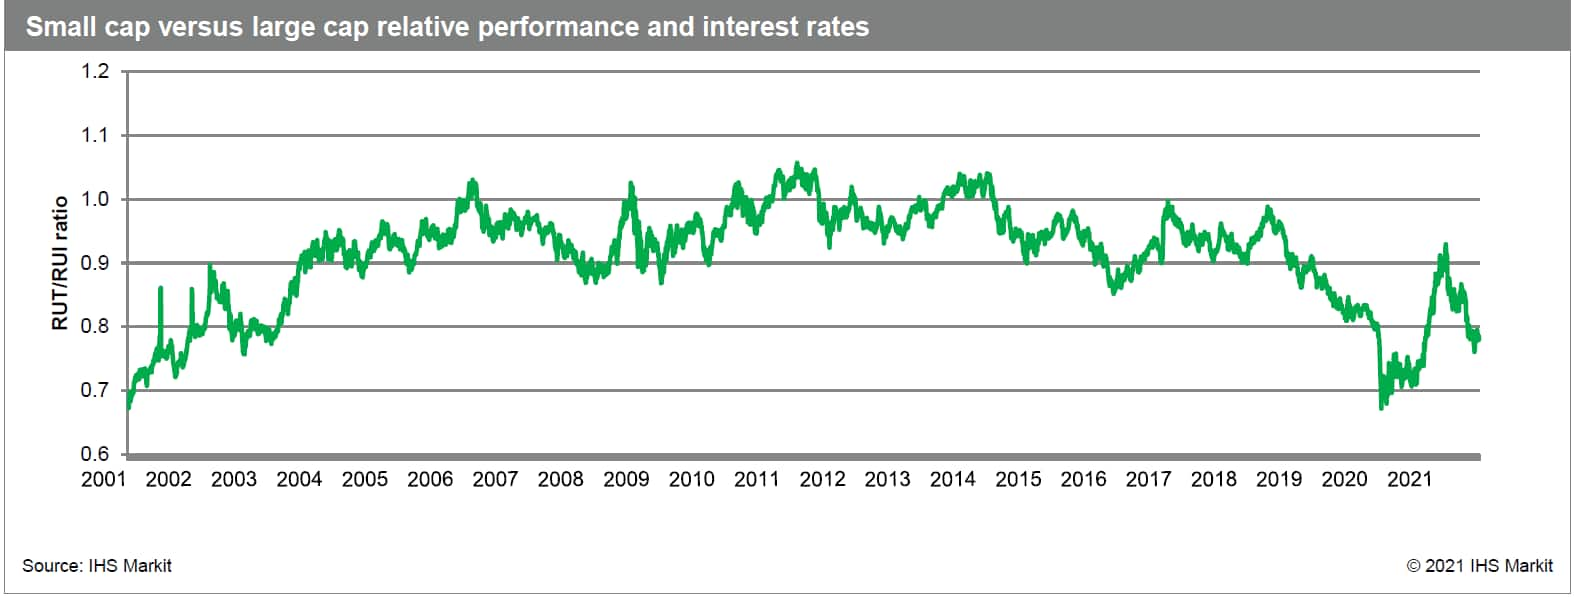
In Figure 1, we present the trend in relative performance of small caps versus large caps gauged by the ratio in NAV of IWM and IWB. A couple of noticeable long term trends include outperformance of small caps following the tech bubble through 2006 and large caps' reign from mid-2018 through early 2020. However, while small caps were the clear winners coming out of the early stages of the pandemic, they once again gave way to large caps since March of this year.
Figure 1
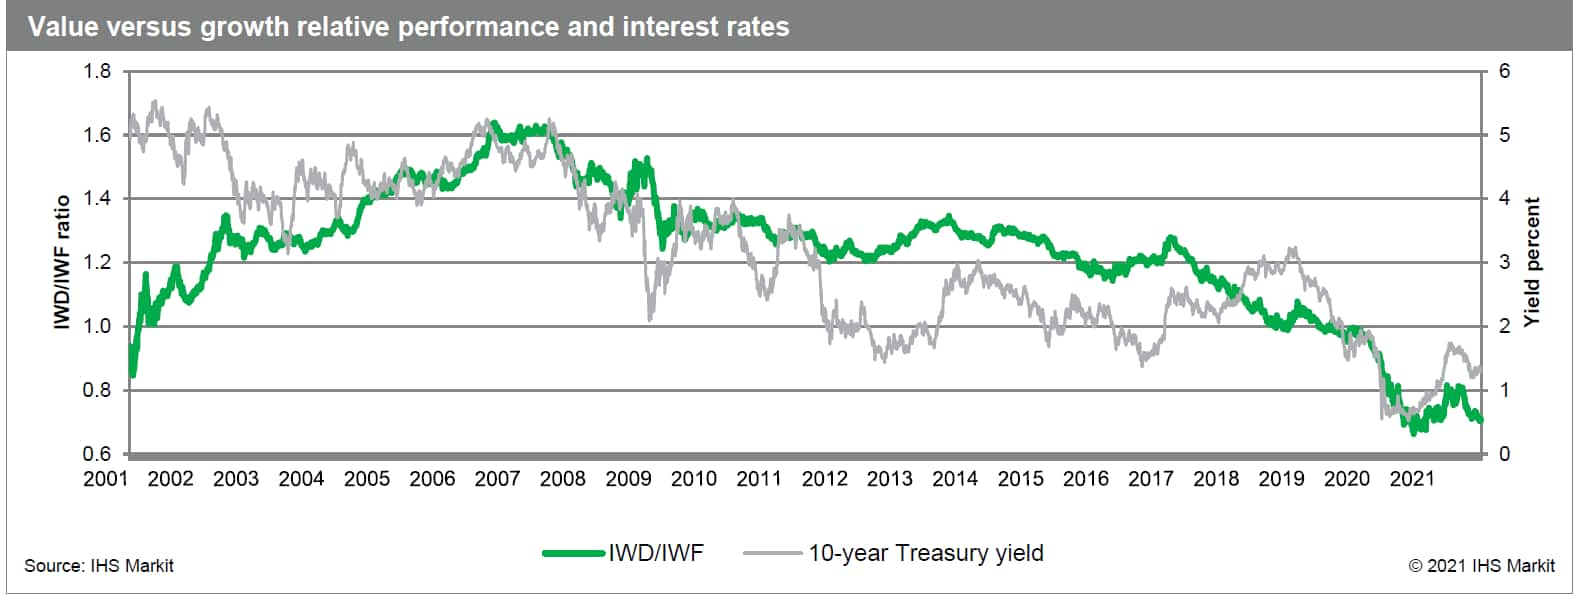
Next, we analyze the value versus growth cycle with respect to interest rates based on the ratio of IWD relative to IWF overlaid with the trend in 10-year Treasury yields (Figure 2). The value cycle coming out of the internet bubble peaked in the second half of 2006 and held steady through mid-2007 before interest rates started their long term downtrend. The ensuing extended period of growth outperformance is identified by the decreasing trend in the ratio, coincident with declining interest rates, which is expected given the benefits of low-rate environments for growth stocks in terms of discounting future cash flows.
Figure 2
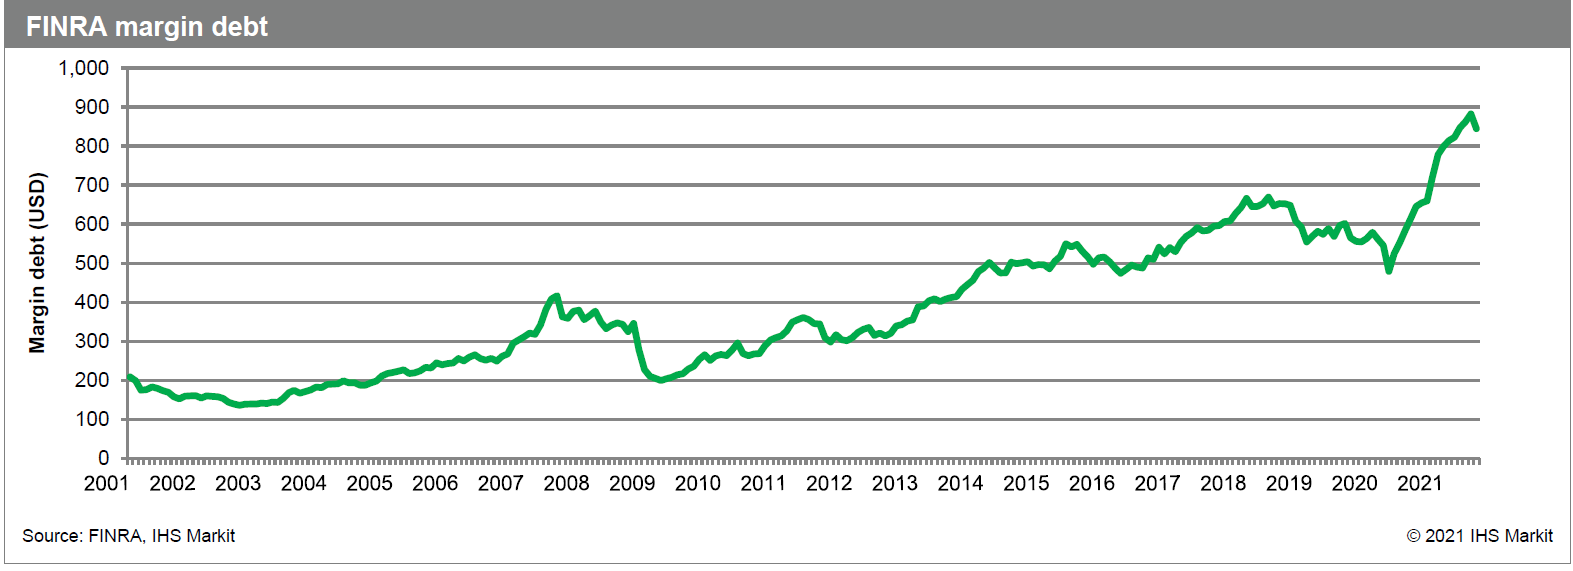
High risk assets were the beneficiaries of the market rebound off the 21 March 2020 pandemic trough, with FINRA data indicating a record amount of margin debt building up, though coming off the peak in June of this year. Along with this substantial amount of leverage in the system, equity retail traders have also become a more significant source of market liquidity, driven in part by brokerage firms' move to offer free trades.
Figure 3
However, according to the new IHS Markit Investment Manager Index™ (IMI) monthly survey, based on data from a panel of 100 institutional investors employed by firms which collectively represent approximately $845bn assets under management, US equity investor sentiment slid to the lowest in 12 months. Expectations of market returns also turned negative on concerns over inflation, central bank policy, rising taxation and the lingering impact of COVID-19. Additionally, equity and commodity markets saw heavy selling on 20 September as Evergrande debt woes and fears of a Chinese property meltdown fueled a risk-off trade sending equity markets to their worst sell off since May.
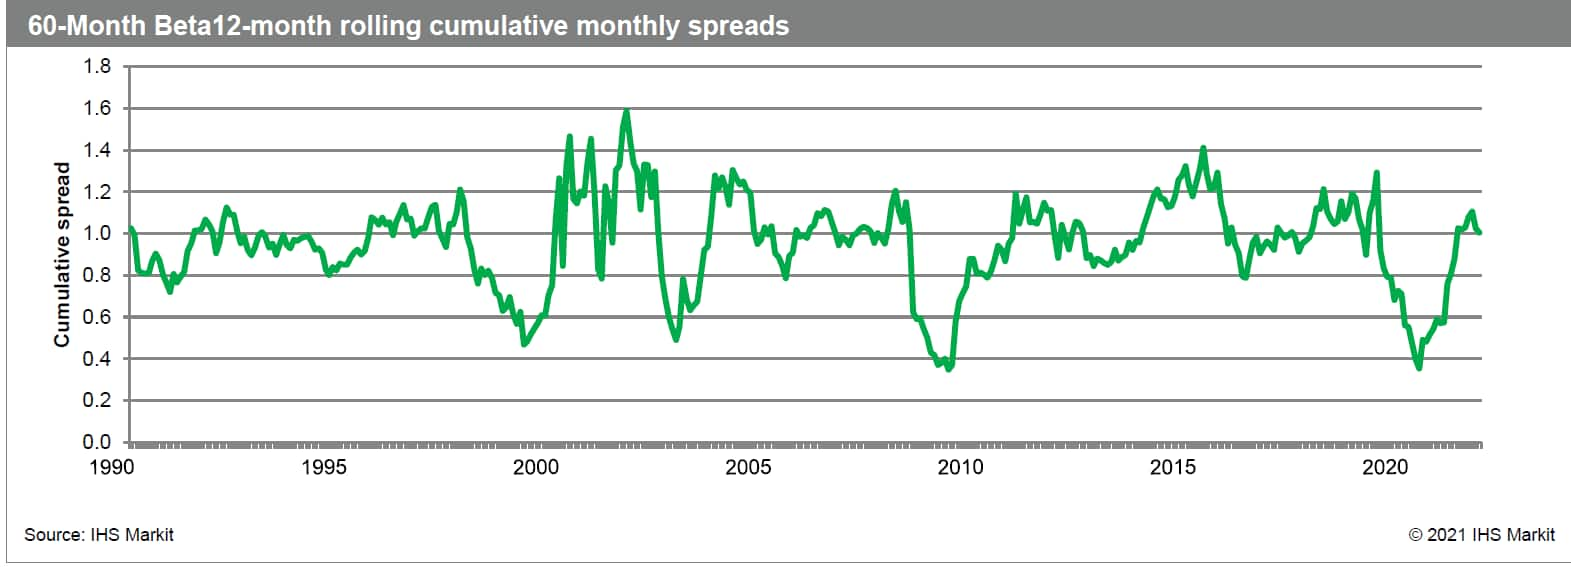
To study these concepts further, we analyze the long term trend in risk appetite measured by the decile spread in 60-Month Beta, which is ranked to favor low risk stocks. Thus, a positive spread indicates outperformance of the lowest 10% risk stocks relative to the 10% highest risk stocks. The universe used here and for the remainder of this report is the US Total Cap universe (representing approximately the top 3,000 names by market capitalization).
In Figure 4 we plot the 12-month cumulative performance of monthly spreads. First, we observe that investors tend to favor higher risk stocks, with an average monthly spread of -0.37% resulting in the 12-month cumulative spread tending to reside below 1.0. Further, high risk stocks tend to strongly rebound off market troughs such as that in late March 2020 which led to the third weakest spread performance in our factor history the following month. Off of this extreme, we find that investors' risk appetite has started to wane, resulting in the 12-month cumulative spread moving above 1.0 once again.
Figure 4
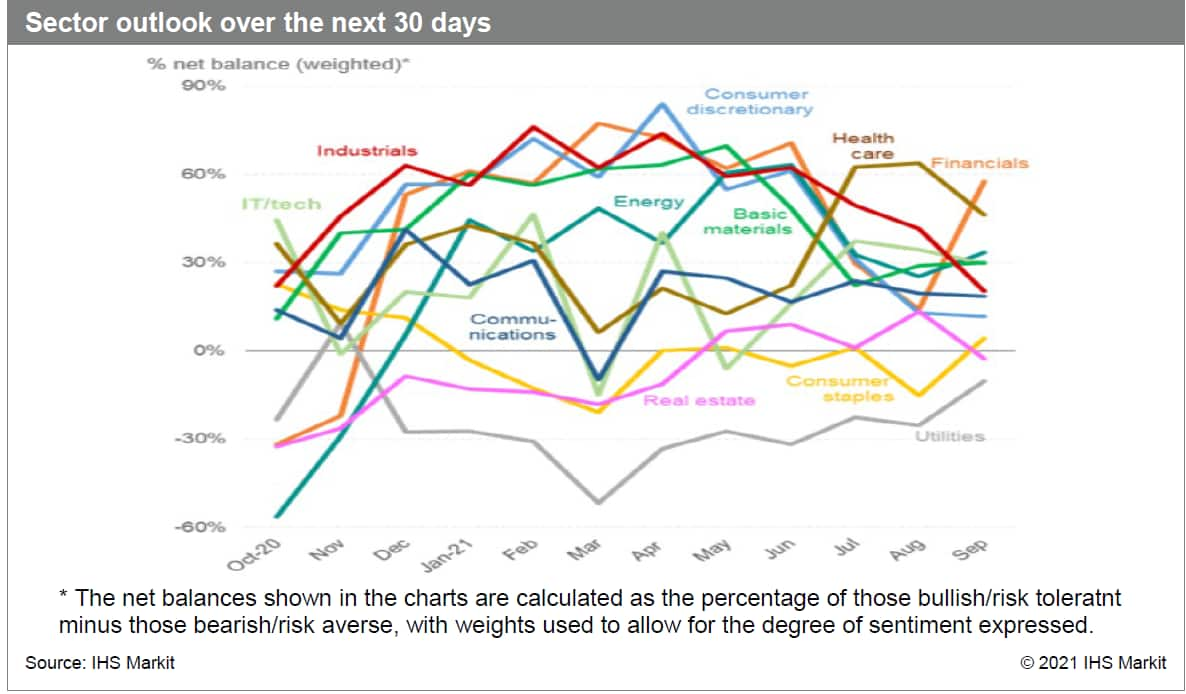
Next, we use the Research Signals Stock Screener to view sector exposures to those stocks in the bottom 10% of 60-Month Beta ranks, in other words, the highest risk stocks (Figures 5 and 6). We find that the Energy and Consumer Discretionary sectors have the highest representation, indicating a greater negative exposure to increasing investor risk aversion. We also note from the recent IMI survey that, while Financials and Healthcare are the most highly favored sectors, investment sentiment towards Consumer Discretionary and Industrials slid to the lowest yet recorded by the survey and Utilities and Real Estate are seeing overall net bearish sentiment (Figure 7).
Figure 5
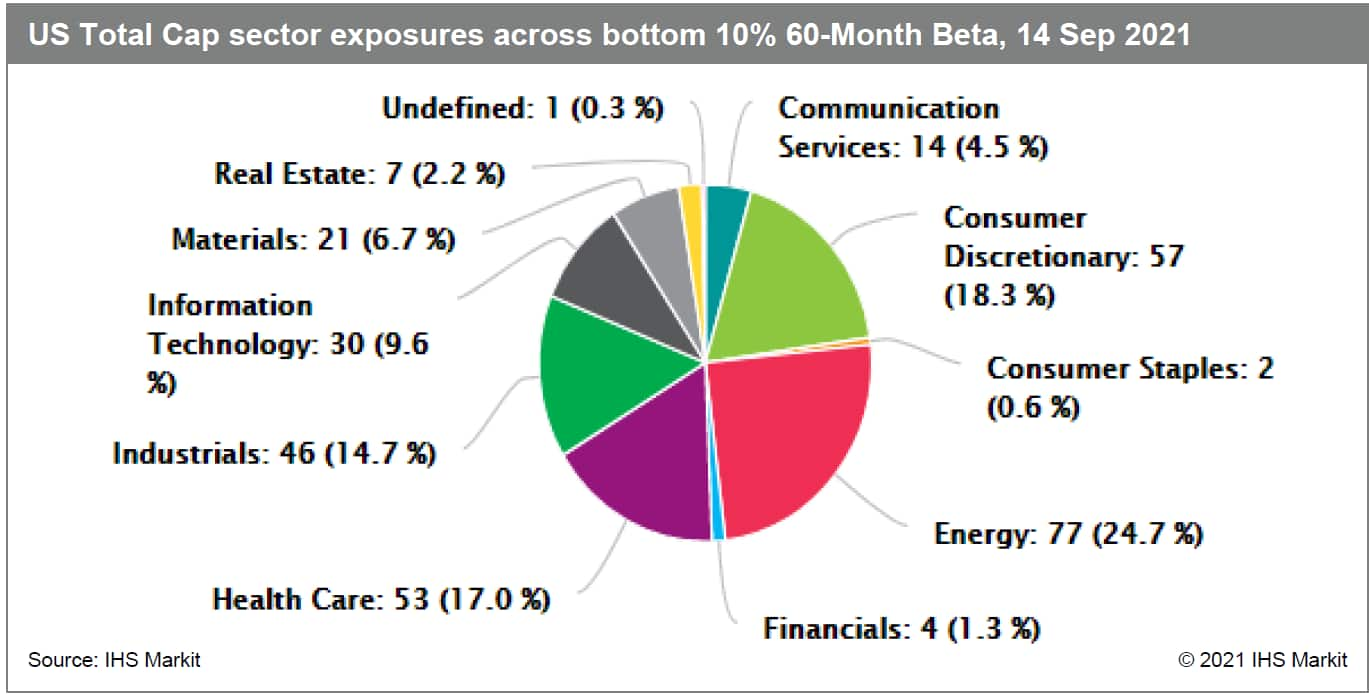
Figure 6
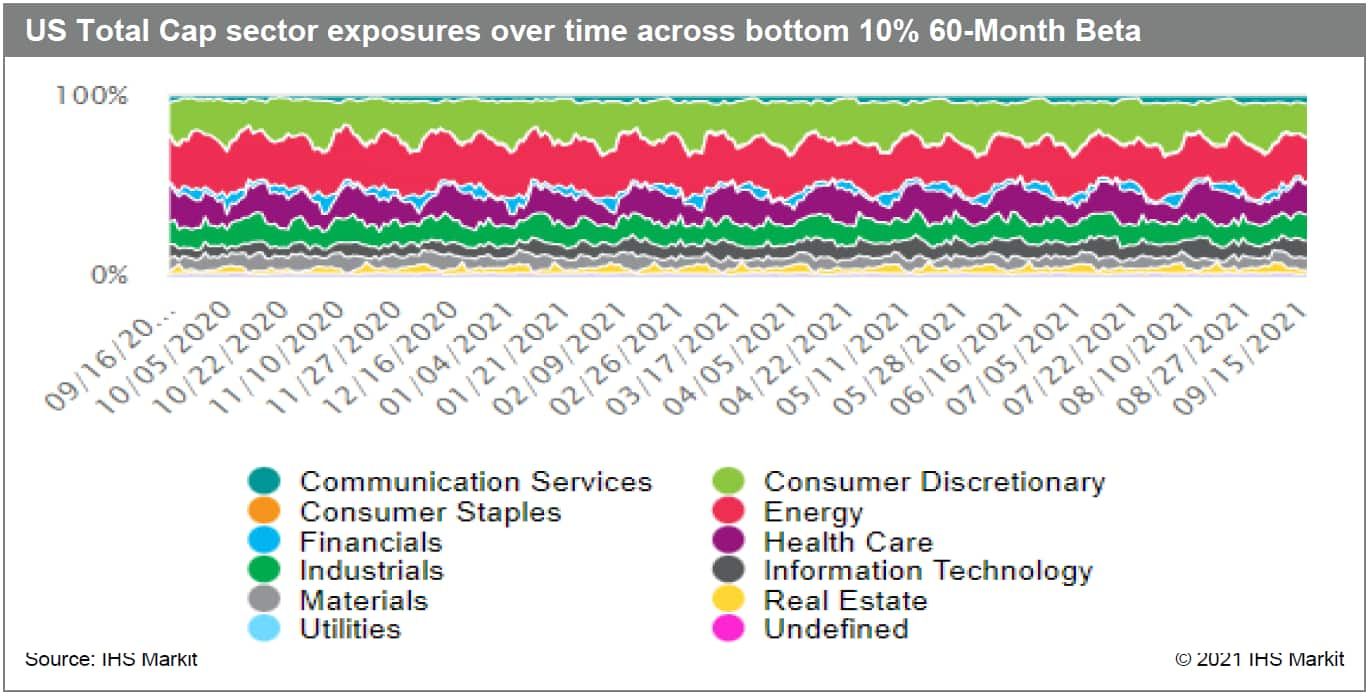
Figure 7
In Figure 2 above, we observe that 10-year Treasury yields have returned to a downward trend since March of this year, suggesting that bond investors are expecting a slowdown in the economy. Concurring with this observation, the 10 September 2021 IHS Markit US GDP Tracking report has GDP decelerating from 6.6% in Q2 (BEA's second estimate) to a forecasted 3.4% in Q3. This dramatically slower growth rate may, in turn, result in a reduction in earnings estimates.
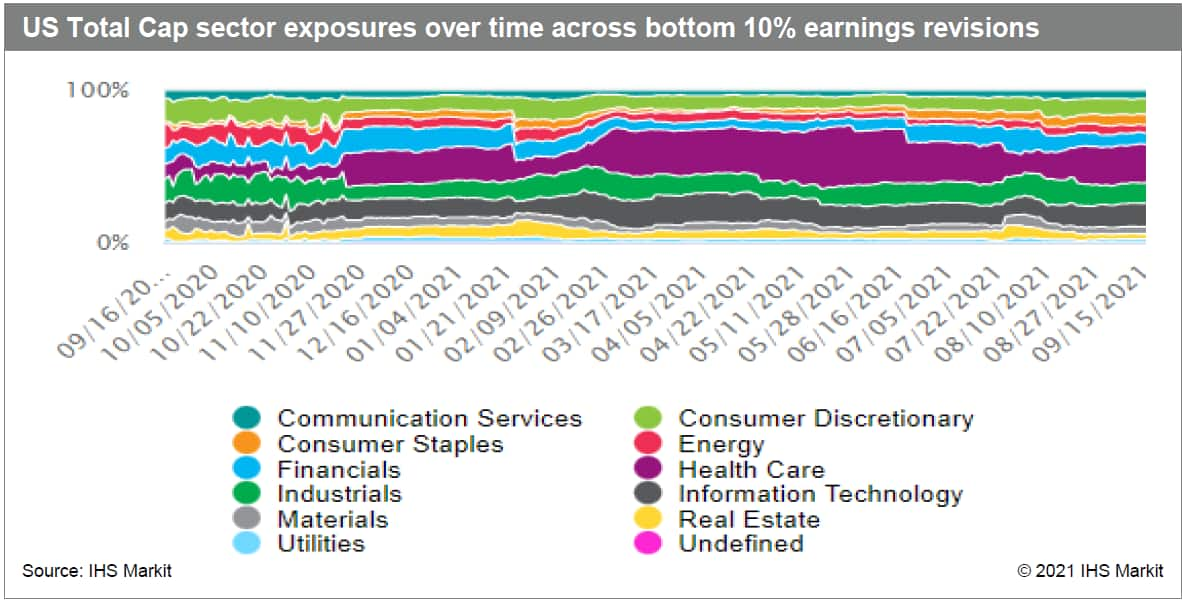
Given this risk to earnings outlook and potential further downgrades to third and possibly fourth quarter earnings, we analyze sector exposures to stocks with the weakest analyst outlook, gauged by 3-M Revision in FY1 EPS Forecasts - Dispersion Relative (Figures 8 and 9). Healthcare, Information Technology and Industrials have the highest number of firms with the deepest revisions, with Healthcare seeing the largest uptick over the past month.
Figure 8
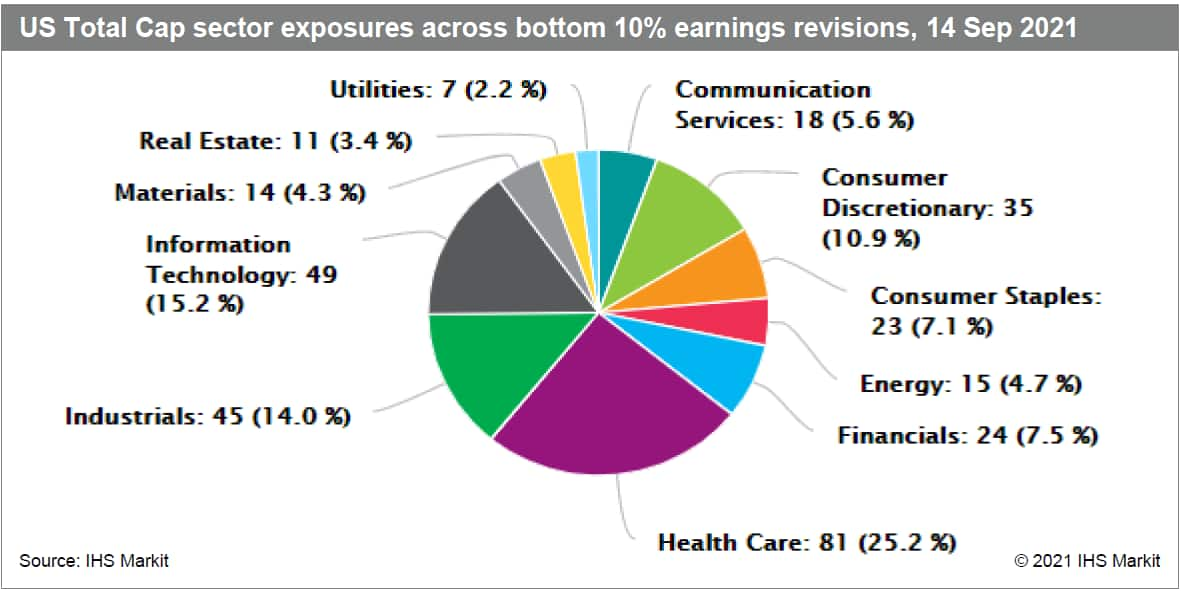
Figure 9
Lastly, we consider the potential impact of the various tax hike proposals that Congress is piecing together, in particular, the proposed introduction of a 2% excise tax for stock buybacks. For this analysis, we screen for firms which have reduced their shares outstanding, based on values less than zero for the factor Percent Change in Shares Outstanding (Figures 10 and 11). The sectors with the highest occurrence of firms buying back shares include Financials and Industrials, followed by Information Technology and Consumer Discretionary. Investment banks within the Financials sector are further exposed to reduced revenues, though in the near term corporate treasurers may move up their buyback schedules to avoid the potential tax prior to its enactment.
Figure 10
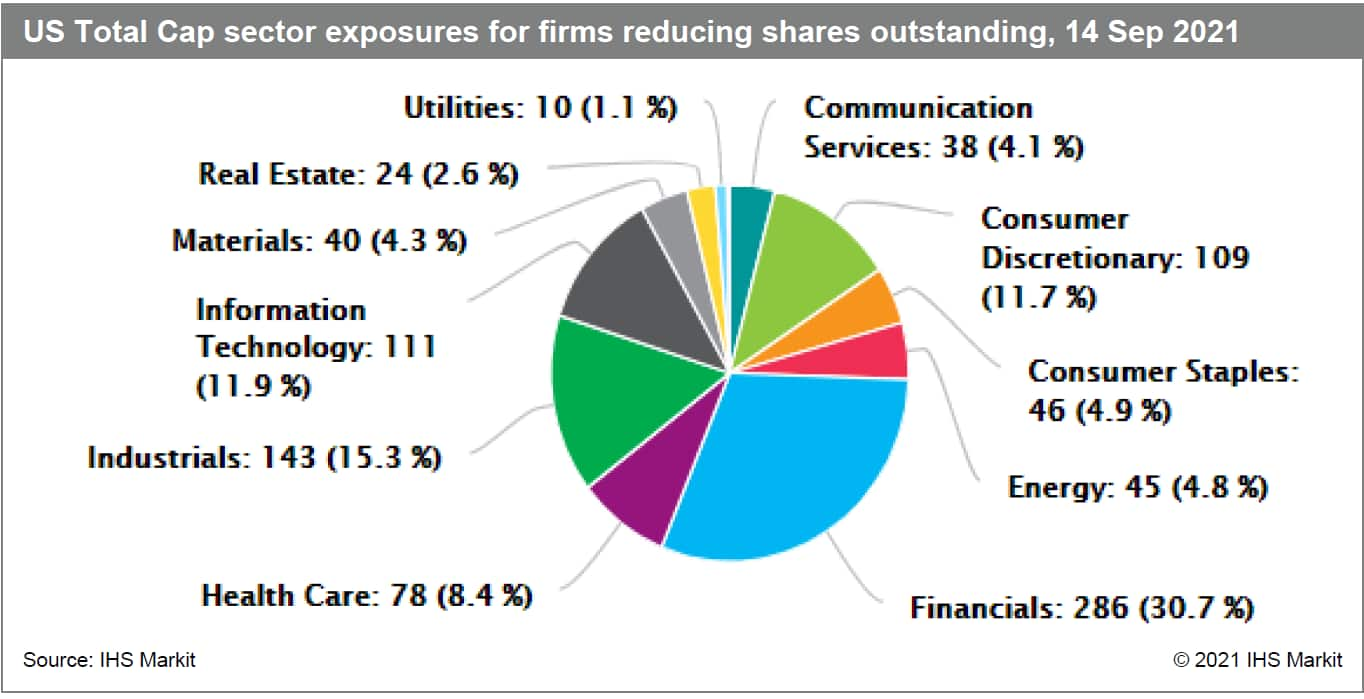
Figure 11
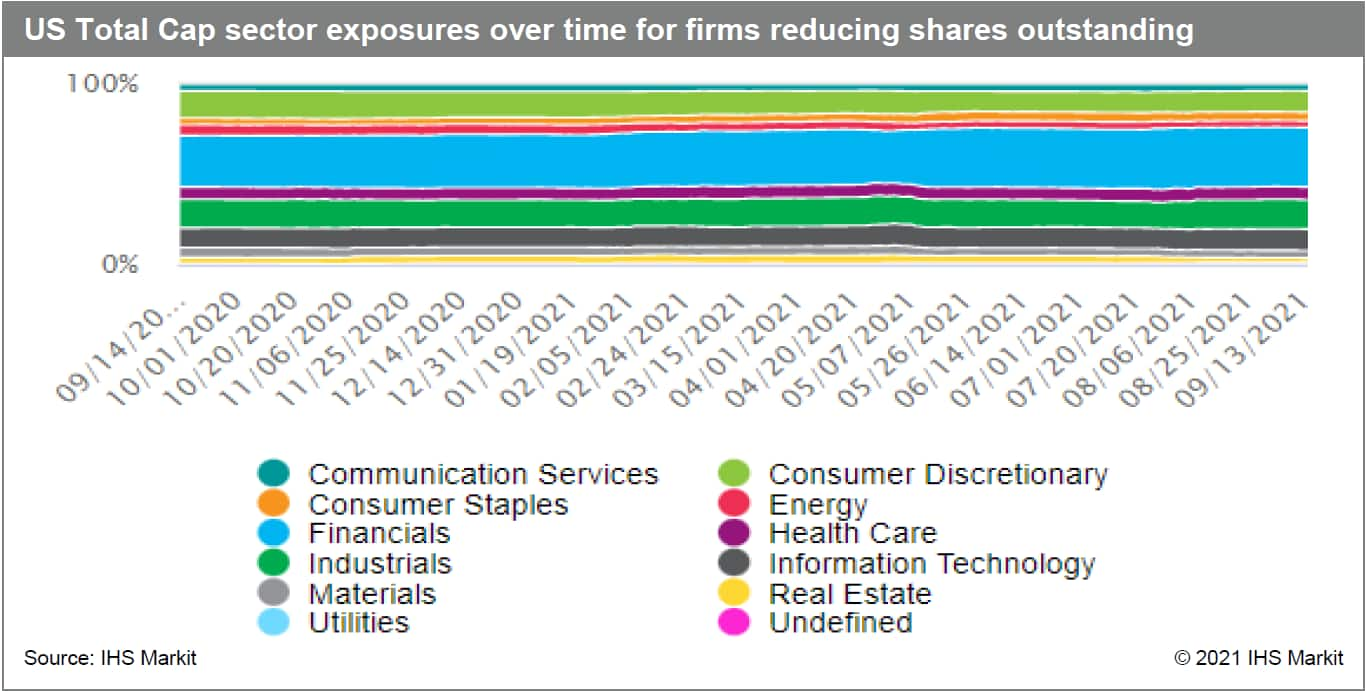
In summary, we identify a handful of sector exposures to potential risks to the US economic recovery. As investors' risk appetite wanes, the prominence of high beta stocks in the Energy and Consumer Discretionary sectors poses a relatively higher risk. Slowing economic growth, as forecasted for Q3 GDP, exposes the vulnerability of Healthcare, Information Technology and Industrials to further downward earnings revisions. Finally, Financials are the most negatively exposed to the proposed tax on share buybacks.
S&P Global provides industry-leading data, software and technology platforms and managed services to tackle some of the most difficult challenges in financial markets. We help our customers better understand complicated markets, reduce risk, operate more efficiently and comply with financial regulation.
This article was published by S&P Global Market Intelligence and not by S&P Global Ratings, which is a separately managed division of S&P Global.