This analytics article utilizes trade data published by IHS Markit Global Trade Atlas (GTA) delivered via the new integrated trade data tool Global Trade Analytics Suite (GTAS)
Key Observations
- The growth rates in exports reported by the top 10 reached the peak in Q2 and then moderated to lower levels in Q3 in line with our prior expectations, since May imports are growing overall stronger than exports
- The adjusted PMI new exports orders readouts for the global manufacturing industry in October 2021 were above the benchmark value of 50.0 points (50.60) the 14th month in a row proving the sustained nature of recovery and still pointing to a positive short-term outlook for global trade
- Transport costs are still at very high levels, adversely affecting global trade flows, but moderated in comparison to October; supply chain disruptions are going to persist at least to Q1/Q2 2022
- The emergence of the Omicron variant is a major new and adverse development; the financial markets reacted heavily to its emergence and the number of states reintroducing stricter contingency measures is increasing fast and that will impact global economic activity in Q4 2021/Q1 2022; thus the variant potentially could become a game-changer
- After a 3.4% decline in 2020, world real GDP is now projected to increase 5.5% in 2021 and 4.2% in 2022 and then moderate further to 3% by 2026
Changes in Trade of the Top 10 Economies
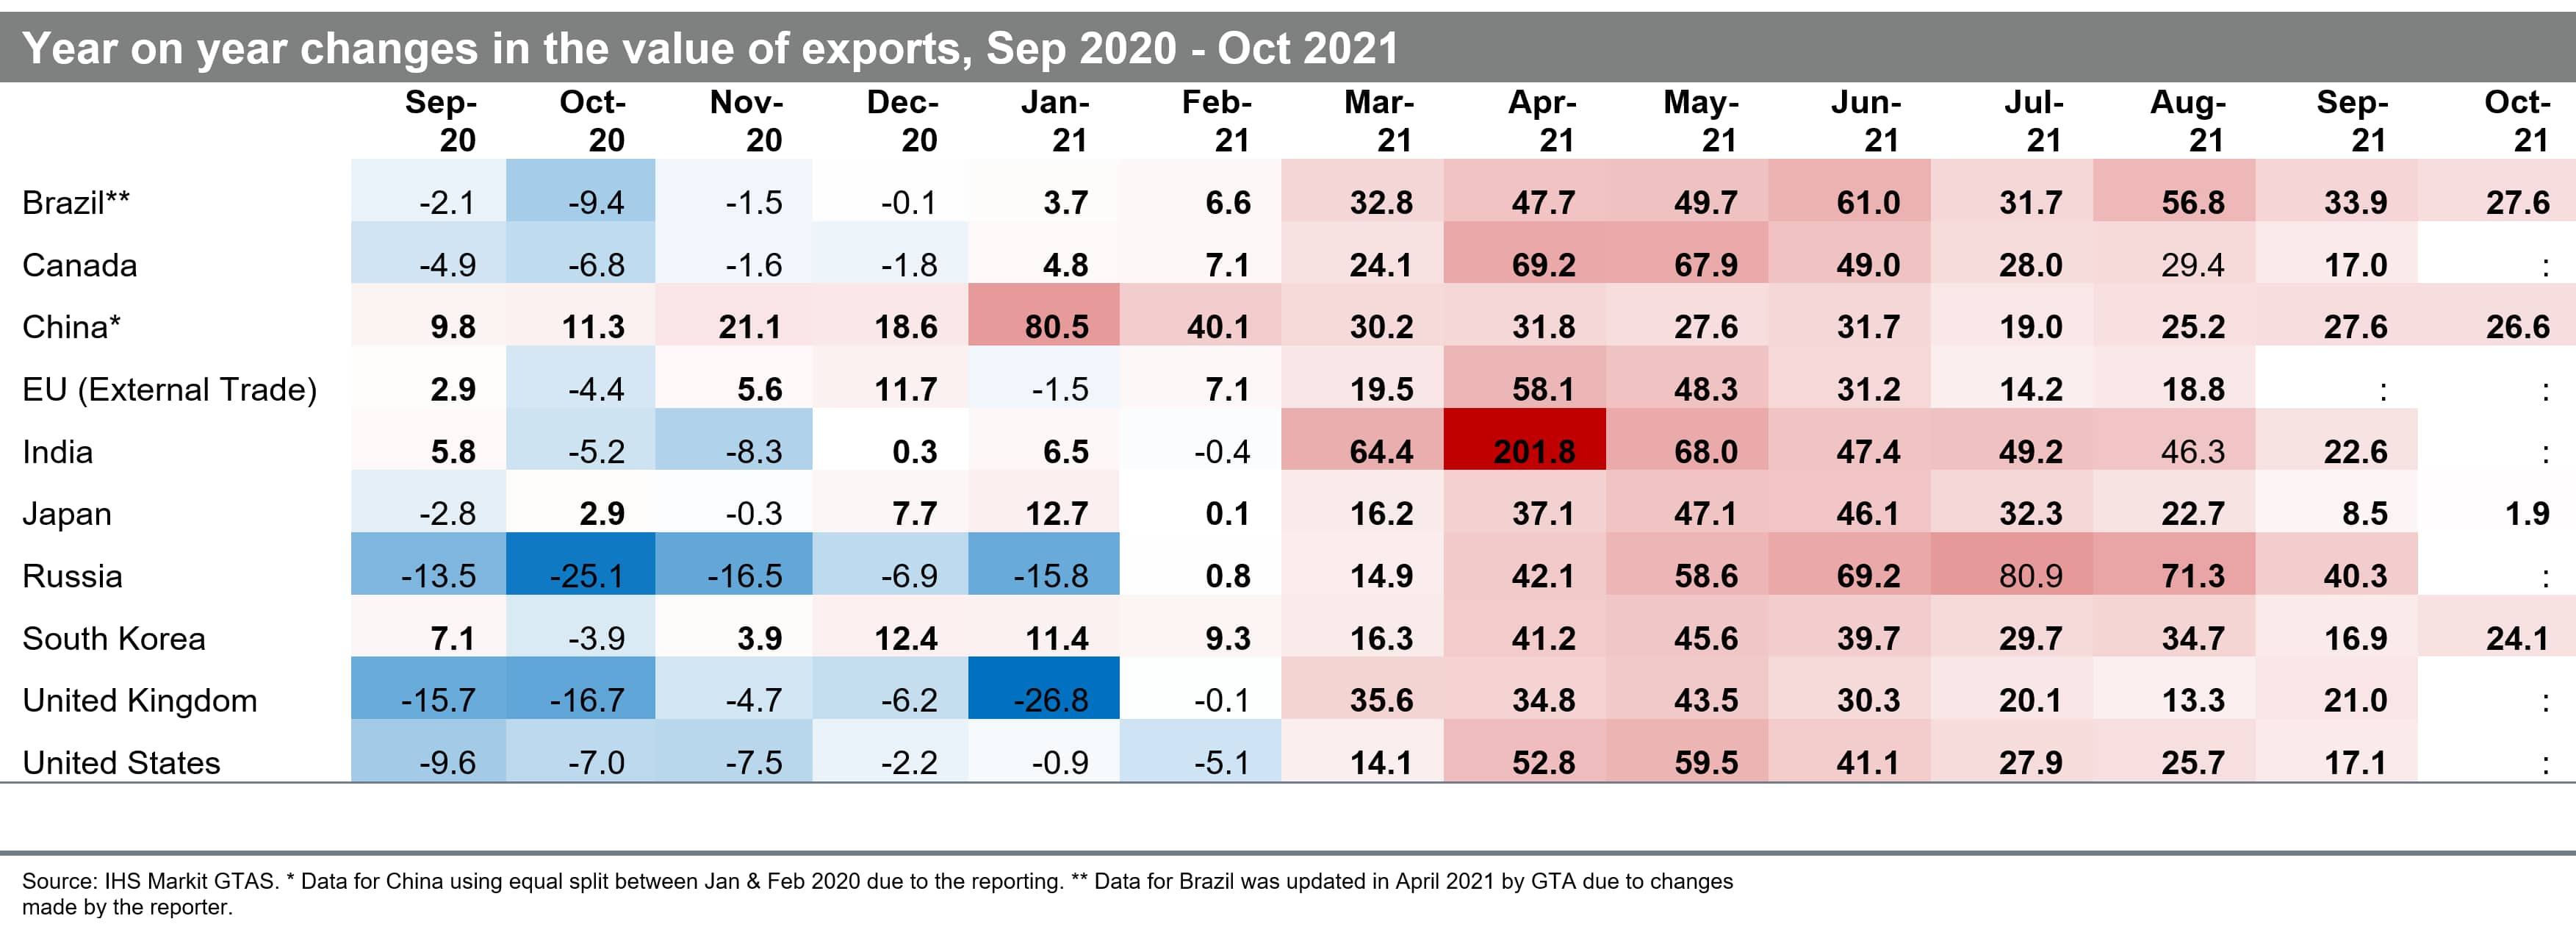
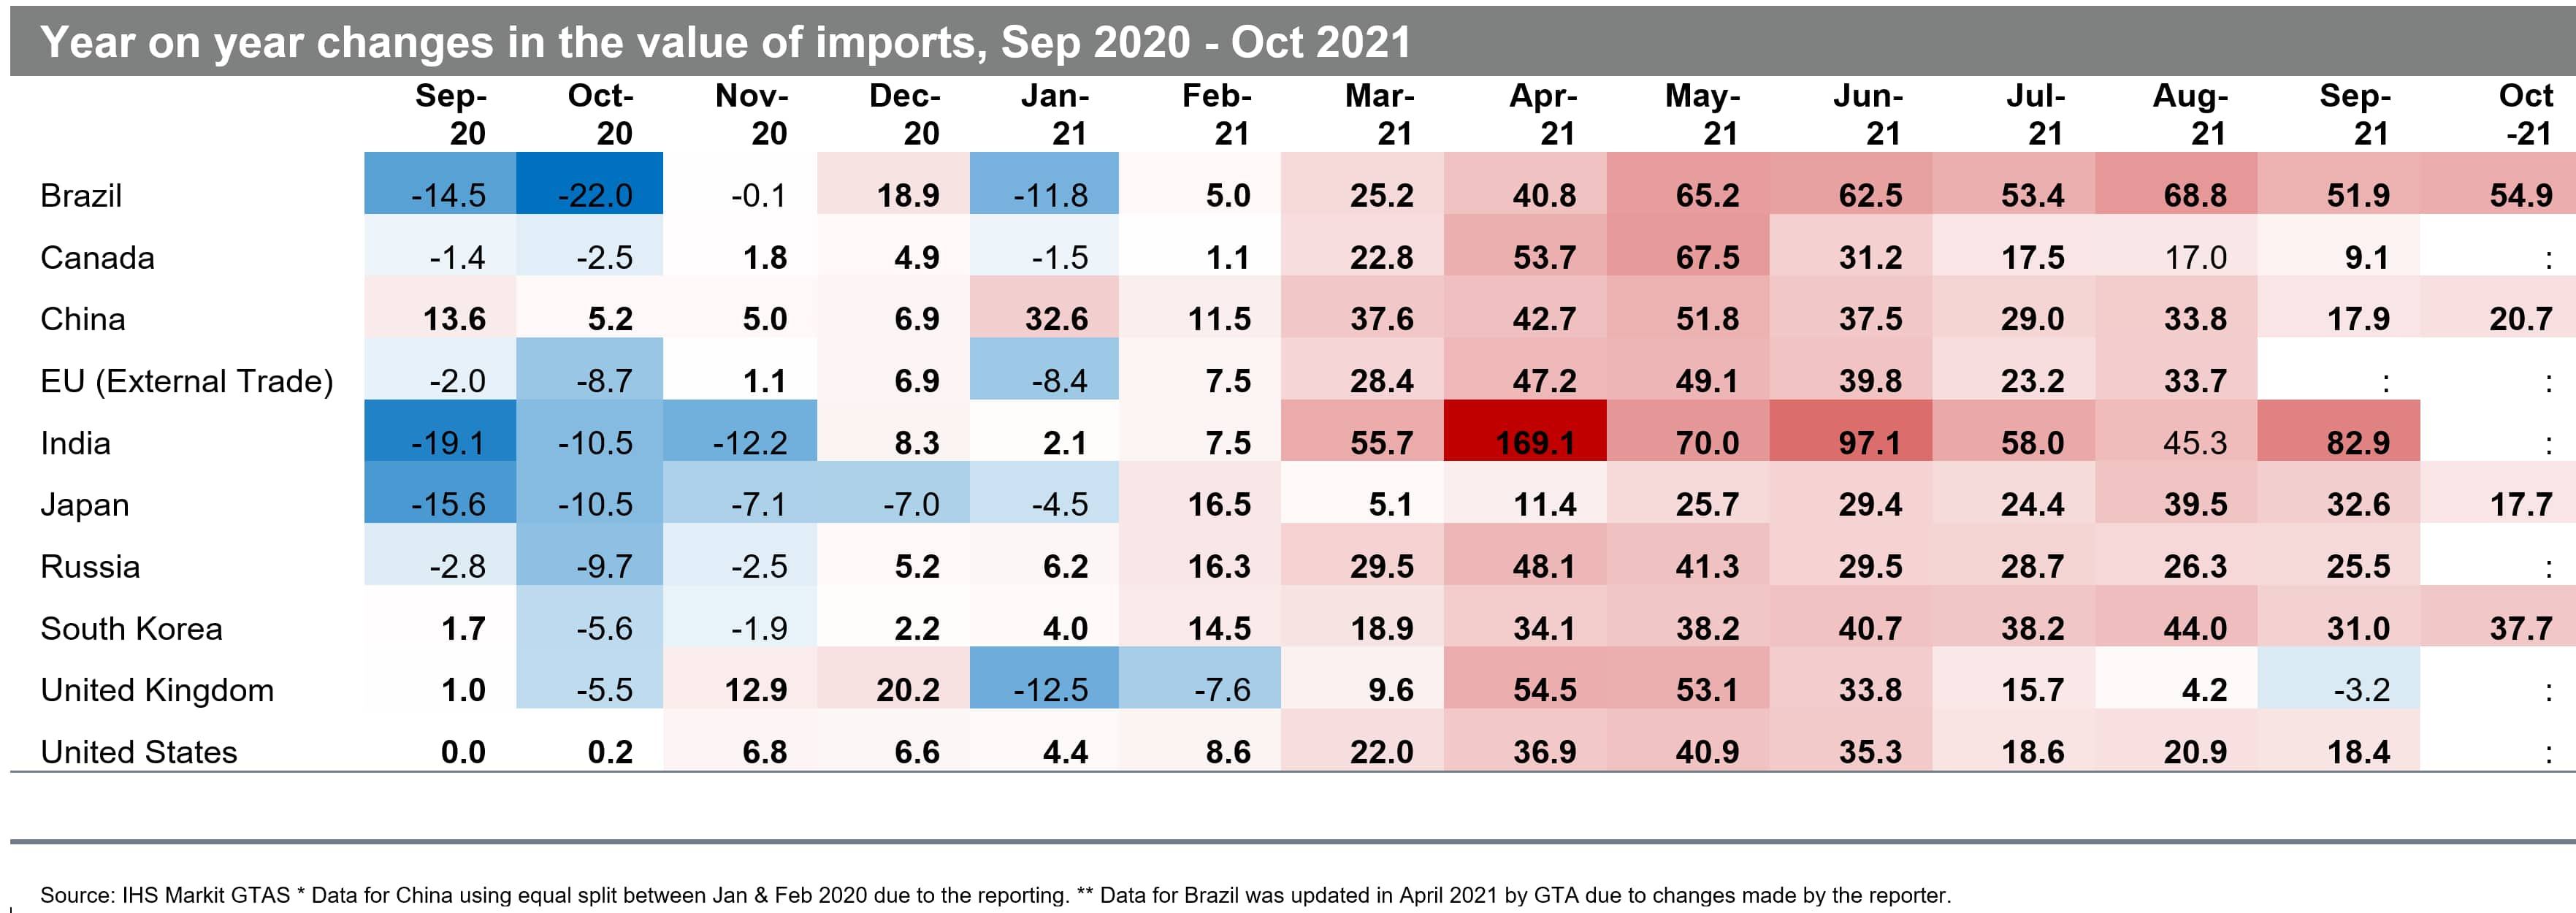
- Exports are growing in all the top 10 states from March 2021 onwards, with the situation in the first two months of 2021 more nuanced; imports, in turn, started growing in all the states a month earlier (Feb 2021) apart from the UK, which showed negative growth rates both in January and February and once again in September
- Generally speaking,the growth rates reported by the top 10 reached the peak in Q2 and then moderated to lower levels in Q3
- The highest yoy growth rates were observed in India in April 2021, both in exports (+201.8% yoy) and imports (+169.1% yoy), the country most adversely affected in April 2020; the base effect is thus apparent and has to be taken into account in the correct interpretation of the data
- The average growth rate for the top 10 economies reached its peaks in April 2021 for exports and May 2021 for imports and are higher for imports ever since which is indicative of strong internal demand and strong consumer confidence
- Four states have already reported data for October 2021 -Brazil (+27.6% yoy in exports), China (+26.6%), South Korea (+24.1%), and Japan (only +1.9%); the growth rates are positive but lower than observed in the preceding months (peak of the recovery), in line with our earlier expectations
- If we compare the nominal value of exports to the last month preceding the global pandemic (Dec 2019), we see that in September 2021, all states reported higher export levels than in December 2019, apart from the UK; among the top 10, China recovered the fastest; among countries that reported data for October, China (mainland) and Brazil still record the highest levels in relative terms with South Korea catching up


Sectoral perspective
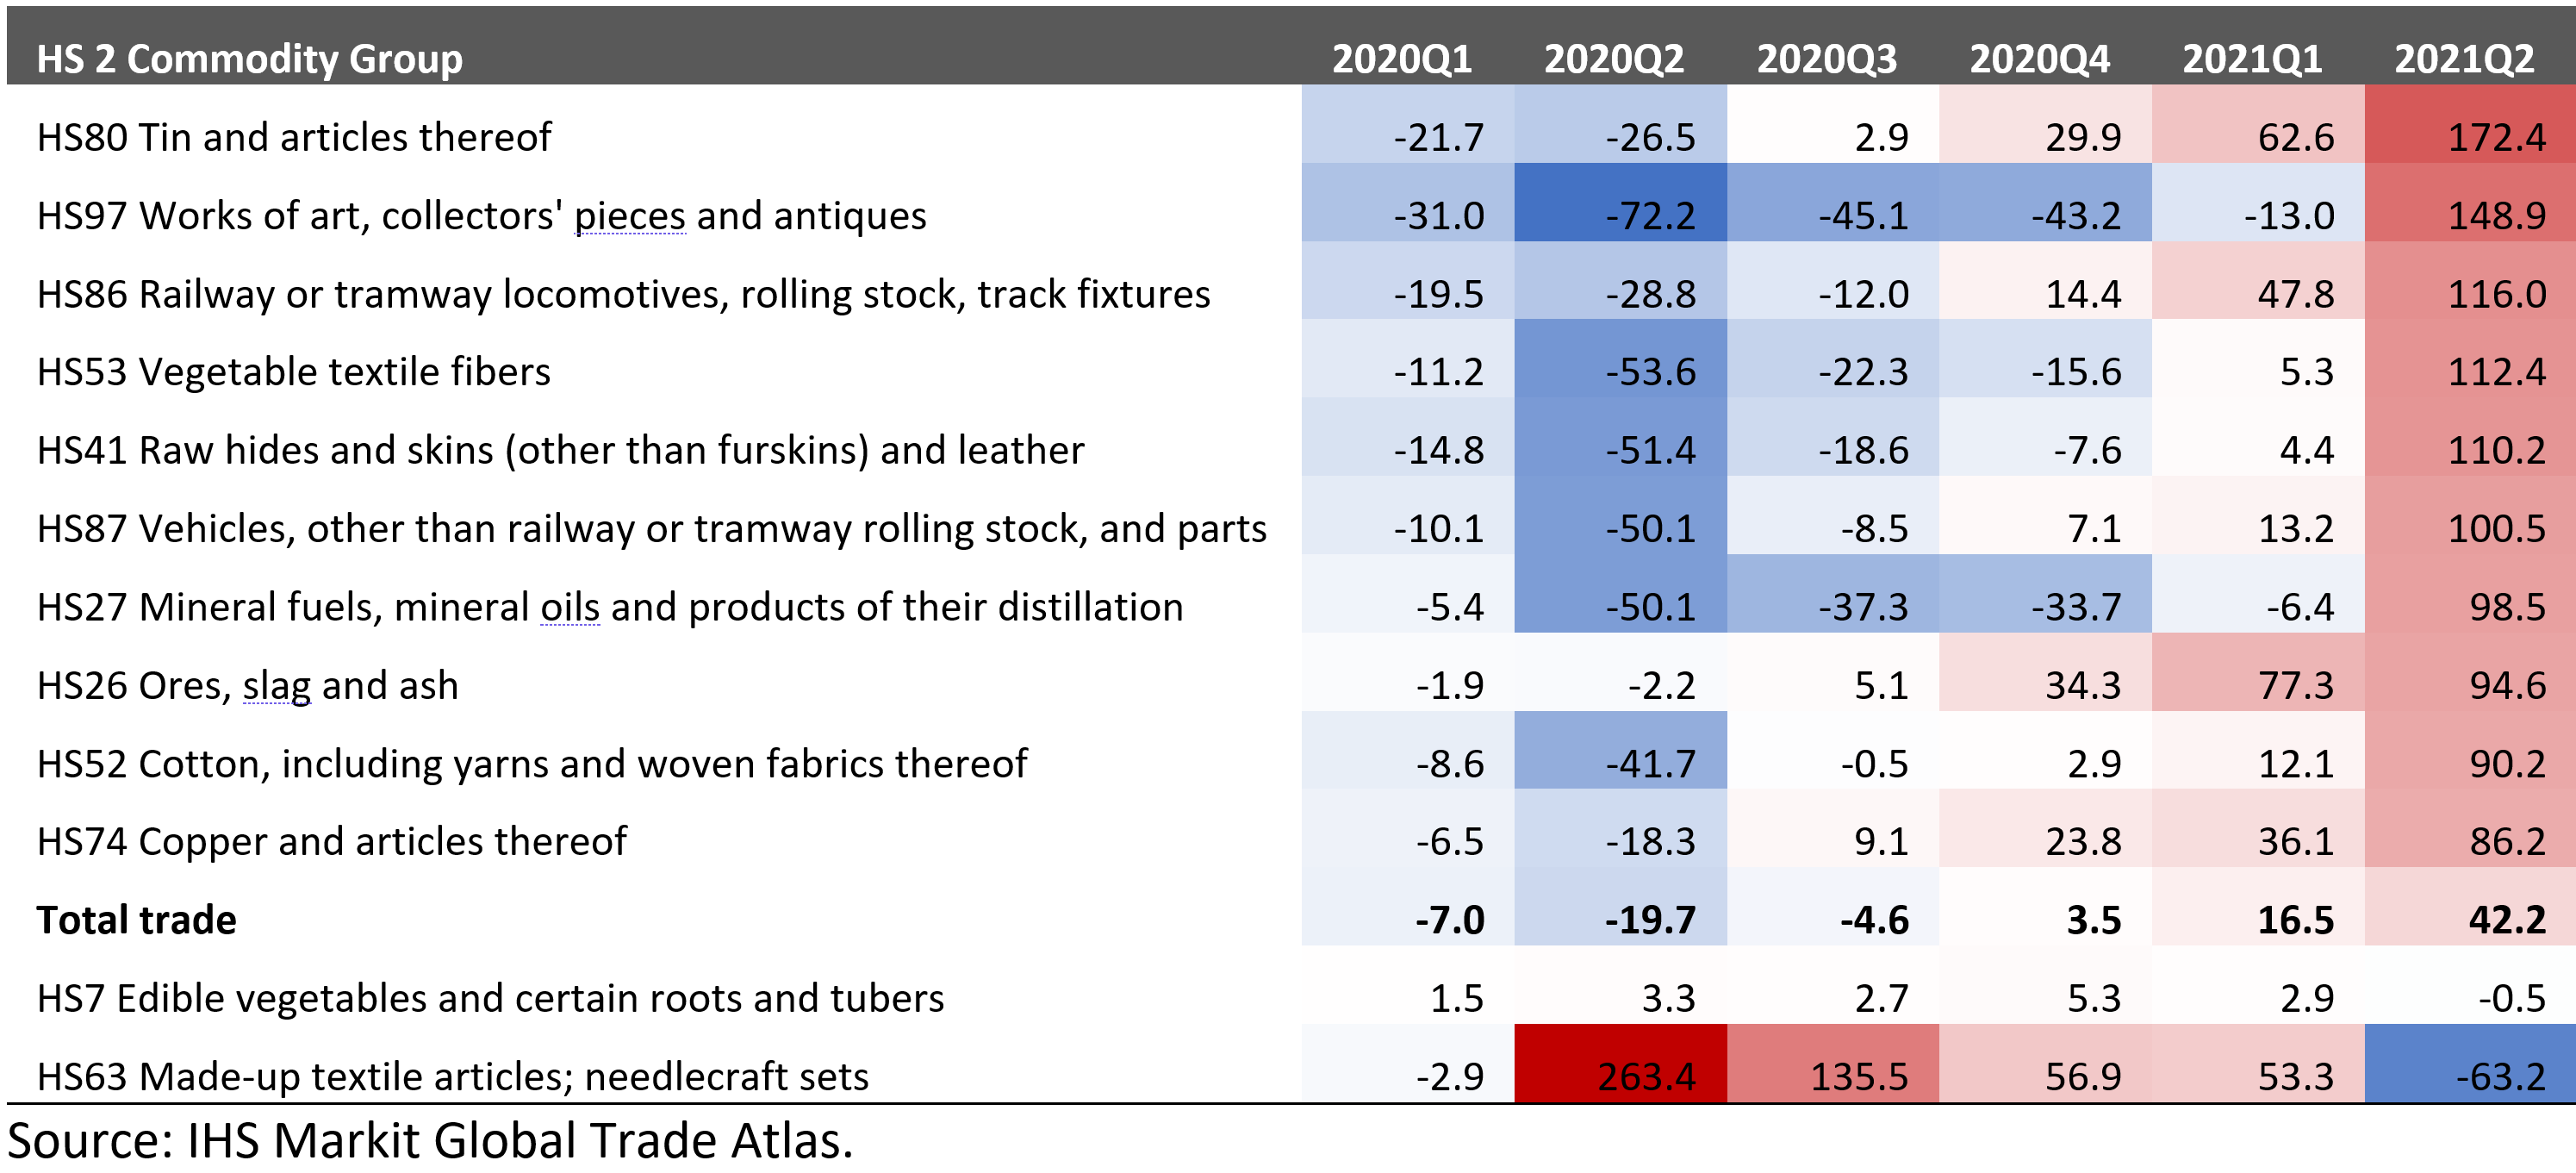
- The recovery in the top ten exports in Q2 2021 is present in nearly all the sectors except for made-up textiles (negative yoy growth rates in Q2, the commodity group seems to behave countercyclically)
- The sectors with the highest growth yoy in Q2 2021 were tin and articles thereof, works of art, collectors' pieces and antiques, railway or tramway locomotives, rolling stock, track fixtures, vegetable textile fibers, rawhides, and skins (other than furskins) and leather as well as vehicles
- In most sectors, recovery started already in Q3 2020, and then the number of recovering sectors increased from quarter to quarter
- Overall, Q4 2020 brought a general recovery (+3.5% yoy), and Q1 2021 generated the foreseen boost to top 10 exports (+16.5% yoy), followed by even more impressive growth in Q2 2021 (+42.2% yoy). We expect the growth to be more moderated in yoy terms in Q3 & Q4 of 2021, for Q3 it is likely to be above Q1 results though

The full version Table with sectoral breakdown for all HS2 codes is available to our Global Trade Analytics Suites (GTAS). Clients only on Connect platform. Contacts IHS Markit Customer Care Customer.Care@ihsmarkit.com for details.
Prospects for the Forthcoming Months
COVID-19
- The overall impact of COVID-19 on global trade and the global economy depends on the duration, severity, and uneven spatial and temporal distribution of the pandemic (changing with the subsequent waves of the pandemic) and the associated severity of containment efforts taken by individual states. The health crises create problems both on the supply side (e.g., due to lockdowns, forced production stoppages, disrupted global value chains) and demand-side (e.g., lower consumer confidence, delayed consumption, lower incomes)
- On 26 November 2021, WHO designated a new SARS-Cov-2 variant B.1.1.529 as a variant of concern, named Omicron, on the advice of WHO's Technical Advisory Group on Virus Evolution. This decision was based on the evidence that Omicron has several mutations that may have an impact on the speed of spread, higher transmitability, or the severity of illness it causes; the markets reacted strongly to the new adverse information with increasing number of states reintroducing stricter contingency measures
- The full impact of this new development will be known only within several weeks when we will understand the severity of the mutation, nonetheless, it is likely to impact global economic activity in Q4 2021/Q1 2022; the variant potentially could become a game-changer
- Before the emergence of Omicron, the econometric analysis by GTAS Forecasting on monthly processed bilateral trade flows has shown that COVID-19 still exerts an adverse impact on international trade flows; however, the effect has been steadily diminishing in magnitude
- The cumulative number of confirmed cases of COVID-19 globally by 28 November 2021 reached 261.5 million and 5.2 million deaths
- The 2-week moving averages of global new cases globally started to rise again by the end of October 2021, with global average death rates following with no apparent delay; the peak of the 5th wave is still ahead of us
- The reported number of vaccinations globally reached 7.81 billion with 3.33 billion people fully vaccinated (with two doses or equivalent one dose), which is equal to 42.7% of the global population; to bust immunity, an increasing number of countries, primarily advanced, started to distribute the third booster dose
PMI new export orders
- The adjusted PMI new exports orders (PMI NExO) readouts for the global manufacturing industry in October 2021 were above the benchmark value of 50.0 points (50.60) the 14th month in a row proving the sustained nature of recovery and still pointing to a positive short-term outlook for global trade; in comparison to September readouts they were lower by 0.42
- Month on month PMI NExO deteriorated the most in the U.S., and increased the most in the case of Canada & India
- PMI NExO in October 2021 for global manufacturing (50.60) is above of, and for global services is below the 50.0 points benchmark (49.31); PMI NExO for global services went up month-on-month for the first time after falling for a quarter
Transport costs
- Transport costs are still at very high levels, adversely affecting global trade flows. It is due to 6-7-year highs in crude oil and natural gas prices, excessive port congestion in many parts of the world, and COVID-19 related contingency measures taken by states affecting the productivity of ports and global logistic chains in general
- The composite index of freight costs by the Shanghai Shipping Exchange moderated to 3245 points (USD/TEU) by the 3rd week of November (it was at the level of 3315) thus falling by -2.1% m/m. It is unlikely to fall significantly before Christmas/New Year season and only can moderate more strongly in the Q1 of 2022; Month-on-month it increased the most on routes to Japan, South Korea & South America, and fell the most on W/C America, W/E Africa & Europe
Real GDP forecasts
- The most recent real GDP growth forecasts from IHS Markit were published on 15 November 2021 and are based on the baseline scenario of the impact of COVID-19 on the global economy (they did not incorporate the omicron outbreak)
- After a 3.4% decline in 2020, world real GDP is now projected to increase 5.5% in 2021 and 4.2% in 2022. The growth rates are expected to vary between 5.0% (3.8% in 2022) for advanced, 6.6% (4.9%) for emerging, and 4.3% (5.1%) for developing states; the growth rates are still predicted to moderate to around 3% in 2026
- IHS Markit ECR team stresses that global economic expansion is unevenly progressing, as the pandemic has uneven distribution across regions. The inhibiting effects of regional outbreaks (next waves) are transmitted globally through trade relations. With expansionary fiscal and monetary policies supporting demand, the implications are widespread supply shortages and escalating prices (inflation readouts are the highest in decades in many parts of the world)
- From a quarterly perspective, real global GDP contracted in every single quarter of 2020, with Q2 being the worst quarter for the global economy in decades (-8.2%)
- The now estimated growth rate in Q1 2021 was 3.5% and varied between -0.1% for advanced and 9.0% for emerging economies. In Q2 2021, real global GDP is estimated to have grown by 11.7%, with the growth impulse stronger for advanced (12.5%) than emerging economies (10.4%). In Q3 growth rate moderated to 4.6% globally (4.2% and 5.1% respectively) and is going to moderate further in Q4 reaching 3.7% globally (4.2% for advanced and 3.1% for emerging economies); starting from Q2 2022, growth in emerging states should start continuously exceed the growth in the group of advanced states thus catching-up could is likely to occur
This column is based on IHS Markit Maritime & Trade Global Trade Analytics Suite (GTAS) data. The full version of the article is available for our clients on Connect platform.
For more details about GTAS, please visit the product page
https://ihsmarkit.com/products/maritime-global-trade-analytics-suite.html
Subscribe to our monthly newsletter and stay up-to-date with our latest analytics


