Featured Topics
Featured Products
Events
S&P Global Offerings
Featured Topics
Featured Products
Events
S&P Global Offerings
Featured Topics
Featured Products
Events
S&P Global Offerings
Featured Topics
Featured Products
Events
Financial and Market intelligence
Fundamental & Alternative Datasets
Government & Defense
Professional Services
Banking & Capital Markets
Economy & Finance
Energy Transition & Sustainability
Technology & Innovation
Podcasts & Newsletters
Financial and Market intelligence
Fundamental & Alternative Datasets
Government & Defense
Professional Services
Banking & Capital Markets
Economy & Finance
Energy Transition & Sustainability
Technology & Innovation
Podcasts & Newsletters
BLOG — Feb 15, 2021
by Ryo Takei
Option prices have long been used to infer market sentiment. By using the Black-Scholes formula, one can derive the implied volatility from an option price and other market observable data - this is the idea behind the oft-quoted VIX, the implied volatility of the (approximately) 30-day S&P 500 index option.
Option contracts at any point in time have the strike and maturity axis, and thus more dense than spot or forward prices. While a scalar indicator such as implied volatility does have utility, it is reasonable to expect option prices to contain more information regarding the market's outlook.
Risk-neutral probability, simply put, is a probability measure that one can deduce from betting prices. Consider, for a moment, how "professional" gamblers approach betting sizes and probability of outcomes: if the betting market wagers 3-to-1 odds that a certain president wins re-election, then it means that someone is willing to wager $1 for the chance to profit $3 if it happens. This would imply that the chance of the re-election is $1 / ($3 + $1) or 25%; this is referred to as the betting market's implied probability of the event. If the gambler feels the actual probability for re-election higher, he will take the bet. The difference between the implied probability and the (perceived) actual probability, if positive, is the value of the bet. In quantitative finance, the market-implied probability is the risk-neutral probability.
Question: is the risk-neutral (or implied) probability always the market's view of the probability of the event happing? In the previous example, it appears so. But consider the next example: suppose the market believes that there is a 50/50 chance of hyperinflation (where money becomes worthless) would it lead to a 1-to-1 odds (i.e. 50% implied probability) of hyperinflation happening? The answer is no. Indeed, a profit of $1 (on a $1 wager today) during a hyperinflation becomes nearly worthless, so surely the bettor would seek much higher odds! Consequently, this will lead to a much lower risk-neutral (or implied) probability. This example illustrates the distinction between the risk-neutral and the actual probability; investors typically demand more profit for bearing risk, especially when the payout occurs much later in time.
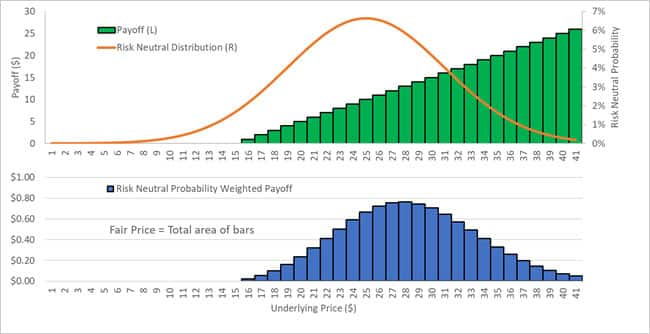
In financial asset pricing, risk-neutral probabilities can be interpreted as the market price of a contract that pays $1 for a set of underlying asset price and zero otherwise at maturity[i]. As an illustrative example, consider a contract that has an arbitrary payoff at some maturity. The payoff curve can be approximated by a set of thin, vertical rectangles that approximate the area under the curve. One can view each thin rectangle as individual contracts that pay $1 at the corresponding underlying price and zero otherwise. Then, fair price of the contract today is the sum of all these individual contracts scaled by their respective risk neutral probabilities. This is the fundamental approach used in pricing derivative contracts.

As an example, the call option which has a hockey-stick shaped payoff curve, as illustrated in the figure above (the strike price is $15). The weighted sum of the payoff curve with the risk-neutral probability gives the fair price of the option:

Remarkably, Breeden and Litzenberger [1] showed that one can reverse engineer the risk-neutral probabilities from a set of option prices with various strikes for a given maturity:

To summarize, for a bet on an event happening at maturity:

Note, the higher the odds, the lower the risk neutral (implied) probability is of the event occurring and vice versa.
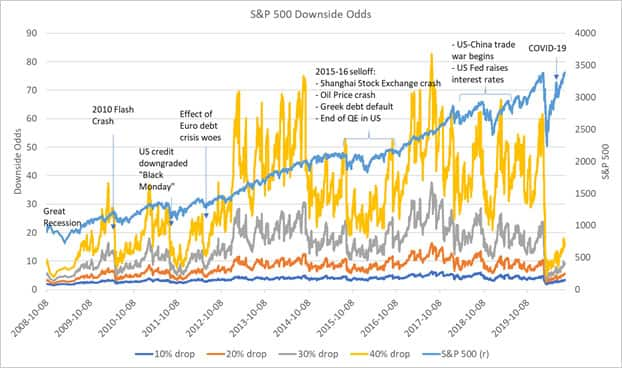
Using IHS Markit's OTCDD Equity Index Options data, we computed the odds of various levels of decline (10%, 20%, 30%, 40%) in the S&P 500 index over a one-year maturity. We call these odds, "downside odds."

One can see that during market turmoil, there is a collapse of the downside odds of all levels of decline - the odds of a 40% decline and 10% decline are surprisingly close! In terms of magnitude, the compression of the odds from the COVID-19 pandemic is the worst since the Great Recession, albeit showing rapid reversion towards normal levels. On a more macro scale, the options market appears to have moved from pessimism to optimism from around the end of 2012, with downside odds at a prolonged elevated level despite being punctuated by short-term selloffs.
Recalling that odds and market prices (of options on the S&P 500, in this case) are equivalent, the downside odds can be a measure to gauge entry or exit into the market. An options trader or a risk manager can compare the downside odds against those generated by their proprietary models. Much like how gamblers execute based on the value of the bet, if the downside odds are significantly greater (smaller) than those suggested by their model, it suggests that the options are underpriced (overpriced), and the trader can execute accordingly.
So far, we have analyzed results around the risk-neutral probability. As we saw in the hyperinflation example, actual probabilities are, in general, distinct from the risk-neutral probabilities. Fortunately, there are mathematical tools to infer the former from the latter, under reasonable assumptions. This would be covered in a future article.
Downside odds for select indices are now available on the Equity Forecasting Utility in the Risk Bureau App. There, the user can plot historical downside and upside odds, as well as visualize the volatility surface and the risk neutral cumulative distribution functions over all strikes and maturities. Gain insights with the Equity Forecasting Utility, view simulated equity prices implied from option markets.
[1] Breeden, D.T. and Litzenberger, R.H., Prices of State-Contingent Claims Implicit in Option Prices. The Journal of Business, Vol 51, No. 4, Oct 1978, pp. 621-651
[i] In theoretical discussions, such a contract is referred to as an Arrow-Debreu security. In practice, it is called a digital or binary option.
Location